
Figure EV3. Distribution of RNAPII phosphorylation across mRNAs and non‐coding RNA genes.
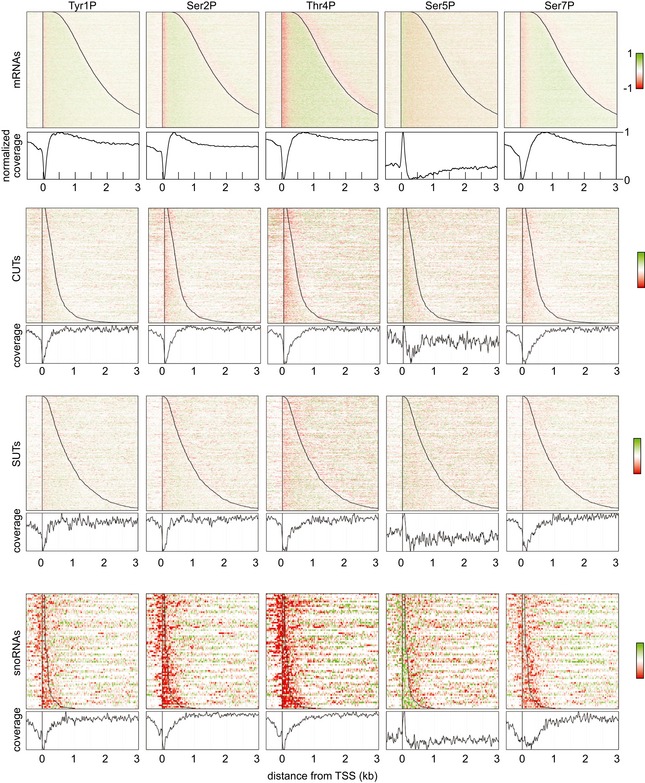
Distribution of RNAPII phosphorylation as in Fig 3A, across all protein‐coding genes, compared to the SUT, CUT, and snoRNA classes of ncRNA. Red color indicates depletion, and green color indicates enrichment of phosphorylation relative to total RNAPII. The graph below each panel shows a metagene analysis of RNAPII phosphorylation enrichment for all genes in each class.