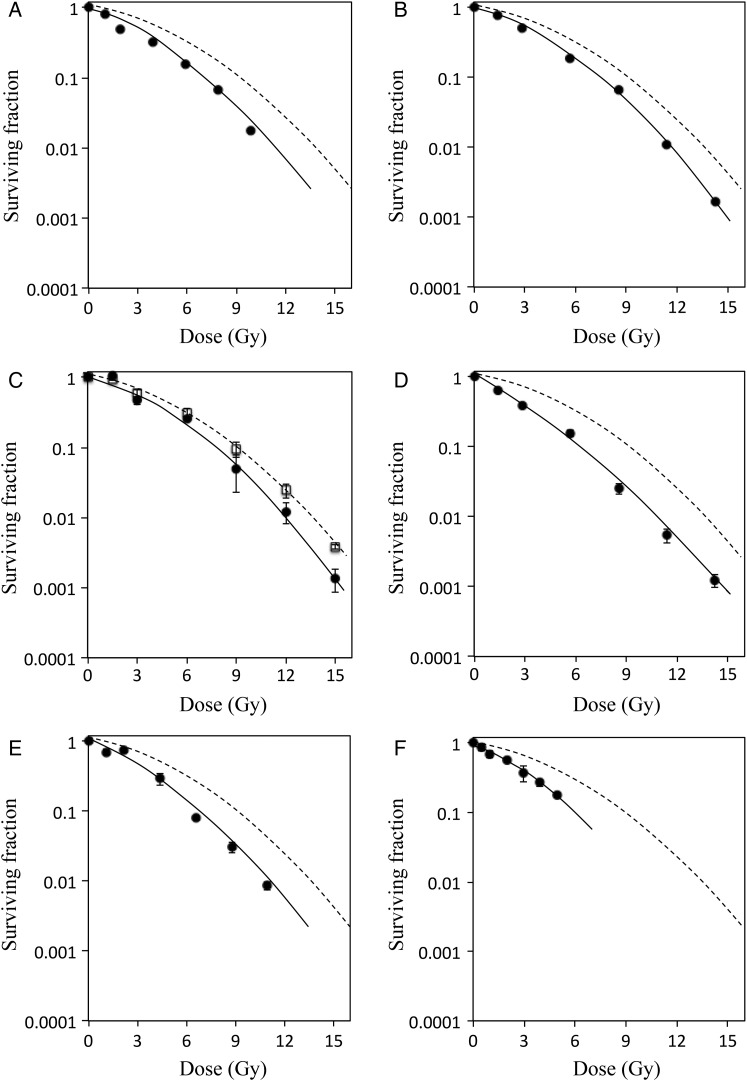
Fig. 1.
Survival curves of V79 cells irradiated with X-rays or with protons at different depths. Clonogenic survival of V79 cells irradiated with X-rays (white square, dashed line) or protons (closed circle, solid line) at each depth (A–F as shown in Table 1); surviving colonies were stained and counted after 7 days of incubation. Dose–response curves were fitted using linear–quadratic models as described in Materials and Methods, and RBE10 and RBE37 values were calculated from D10 and the D37 values. With regard to spatial resolution of dosimetry system, the dose error was <0.5%.

