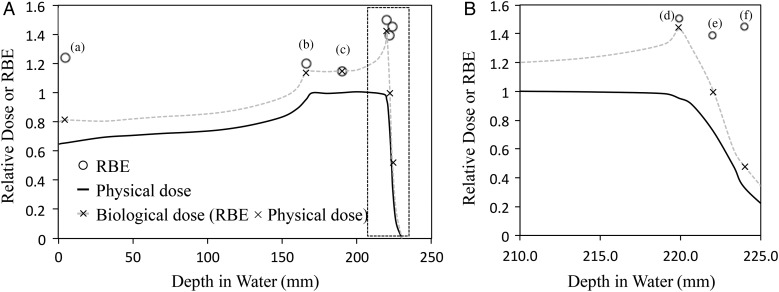
Fig. 2.
Relative dose–depth distributions in V79 cells. Relative physical doses (black solid line), RBE10 values calculated at D10 (white circle) and RBE10 × physical doses (×) at each depth (a–f as shown in Fig. 2) of the proton beam; the physical dose was normalized at the SOBP center. Data are presented for (A) all positions (a–f) from 0 to 245 mm depth from water and (B) the distal region (d–f) from 210.0 to 225.0 mm depth from water.

