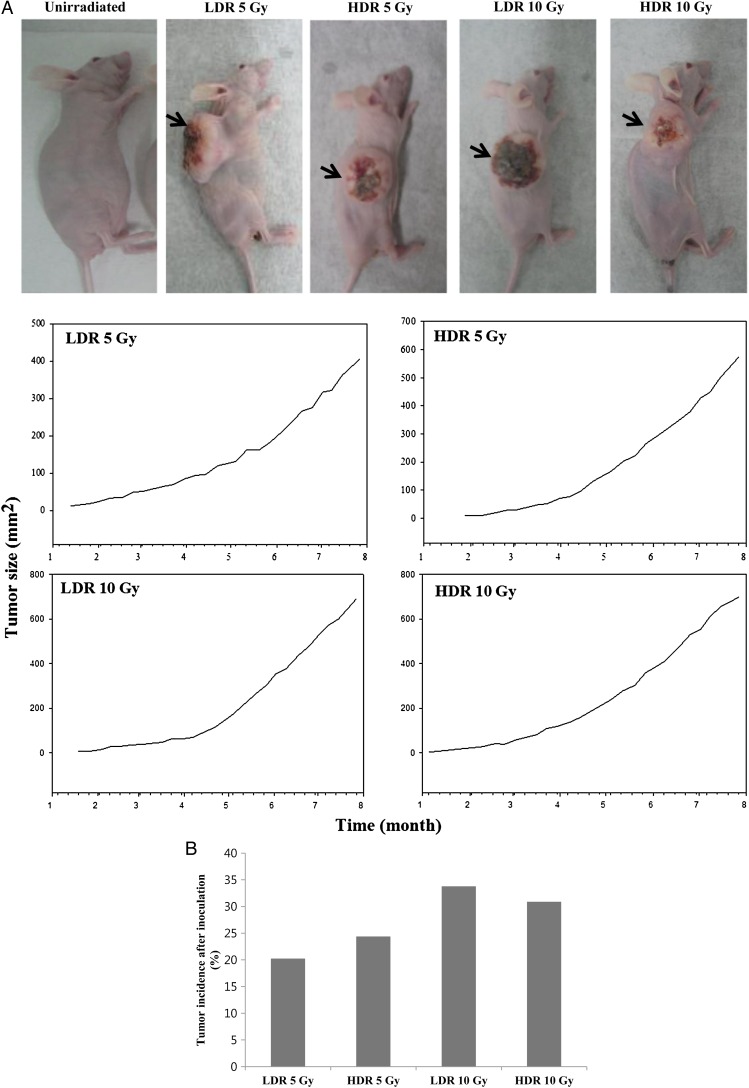
Fig. 5.
Tumorigenicity of HTori-3 cells in nude mice. (A) Representative photographs of tumor formation in nude mice. Arrows indicate location of tumors. Tumor size was monitored once per week. (B) The tumor incidence rate in each group after 16 weeks: low-dose-rate (40 mGy/h) 5 Gy, 20.24%; high-dose-rate (4.68 Gy/min) 5 Gy, 24.39%; low-dose-rate 10 Gy, 33.78%; and high-dose-rate 10 Gy, 30.88%.

