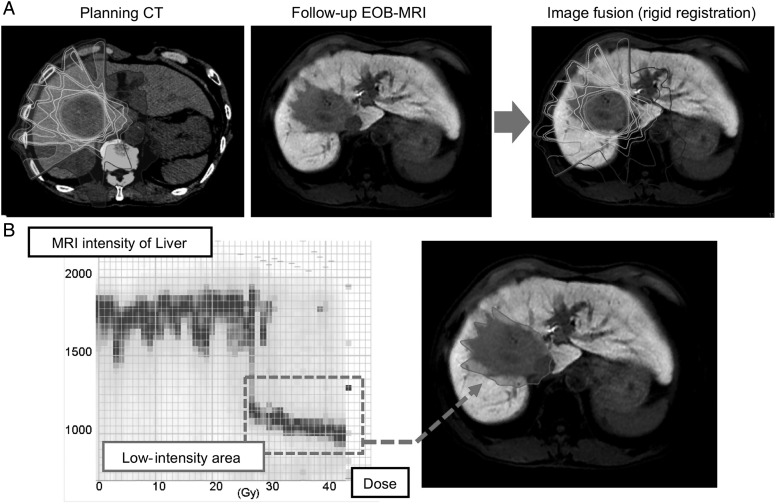
Fig. 1.
Analysis of dose distribution in the follow-up MRI. (A) The EOB-magnetic resonance image was fused to the planning CT image. (B) For each patient, a histogram was constructed to analyze the correlation between the low-intensity area on the LAVA image and the delivered radiation dose. The x-axis and y-axis indicate the absolute physical dose received by the liver and MRI signal intensity, respectively. The threshold dose was identified in each patient (inset). MRI = magnetic resonance imaging; CT = computed tomography; EOB = adolinium-ethoxybenzyl-diethylenetriamine pentaacetic acid; LAVA = liver acquisition with volume acceleration.

