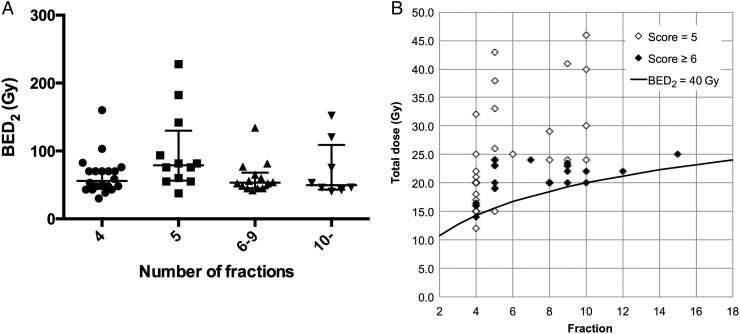
Fig. 5.
Threshold BED2 according to fractionation regimen in patients with liver cirrhosis. (A) Threshold BED2 values were plotted according to the number of fractions in cirrhotic patients. Error bars indicate the medians with interquartile ranges. Fractionation regimen was not significantly correlated with hepatic dysfunction (P = 0.1019). (B) Total radiation dose was plotted against the number of fractions in cirrhotic patients with Child–Pugh scores of 5 and ≥ 6. The solid line indicates a BED2 of 40 Gy. BED = biologically effective dose.

