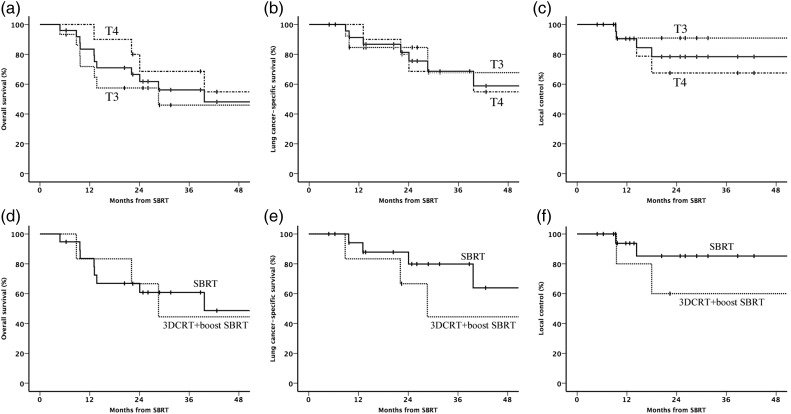
Fig. 1.
Kaplan–Meier plots for all patients (n = 25) (solid line), patients with T3 (n = 15) (dotted line) and patients with T4 (n = 10) (dash-dotted line) disease. (a) Overall survival, (b) lung cancer–specific survival and (c) local control. (d) Overall survival, (e) lung cancer–specific survival and (f) local control for patients (n = 19) treated with standard SBRT (40 Gy/5 fr or 50 Gy/5 fr) (solid line) and patients (n = 6) treated with 3D conformal radiotherapy (3DCRT) following SBRT boost.

