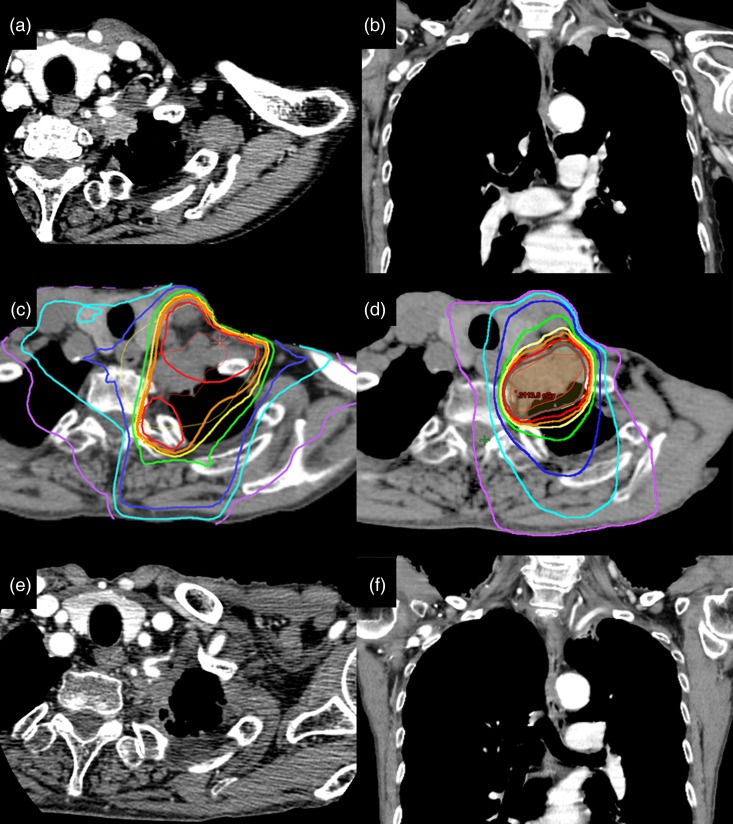
Fig. 3.
Computed tomographic (CT) appearance and dose distribution in a patient with a superior sulcus tumor. (a) (b) Axial and coronal CT images obtained before SBRT. (c) Dose distribution curves of 3D conformal radiotherapy (3D-CRT). The isodose lines, from outer to inner, represent 5 Gy, 10 Gy, 15 Gy, 20 Gy, 22.5 Gy, 23.75 Gy, 25 Gy and 26.75 Gy, respectively. (d) Dose distribution curves of SBRT. The isodose lines, from outer to inner, represent10 Gy, 20 Gy, 30 Gy, 40 Gy, 45 Gy, 47.5 Gy and 50 Gy, respectively. (e) (f) Appearance on axial and coronal CT images obtained 15 months after SBRT. The patient was a 70-year-old woman diagnosed with a superior sulcus tumor at another hospital. She initially received chemotherapy (cisplatin and pemetrexed) alone because the hospital did not have a radiation therapy unit. She was then treated at our institution using 3D-CRT with 50 Gy in 25 fractions before SBRT because invasion to the brachial plexus was suspected based on the symptom of left-arm dysesthesia. One month after 3D-CRT, SBRT (25 Gy in 5 fractions) was administered to the residual tumor. Twenty months after SBRT, to date, the tumor remains controlled and there have been no toxicities, such as brachial plexus neuropathy or brachial edema.

