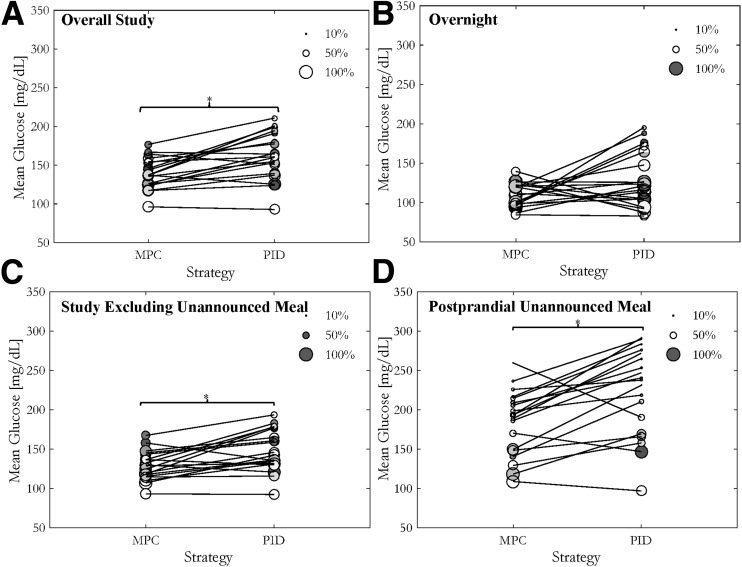
Figure 3.
Bubble plot representation of the individual mean (black lines; center of the circles) and % time in 70–180 mg/dL range (radius of the circle) of the glucose values (CGM) experienced by each subject controlled by the PID or MPC algorithms for the entire study (A), the overnight period (B), and the study period excluding the unannounced meal (C). Mean (black lines; center of the circles) and % time in 70–180 mg/dL range of the glucose values experienced by each subject during the 5-h postprandial period after the 65-g unannounced meal are displayed in D. *Statistically significant differences in the mean values (P < 0.05).

