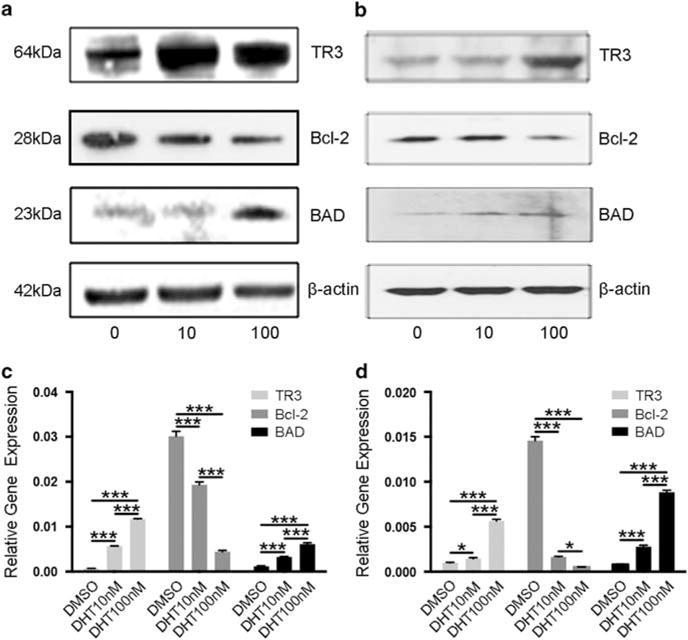
Figure 4.

Upregulation of TR3 after DHT treatment. (a) Western blot analyses of TR3 protein expression in DHT-treated HaCaT cells. Cells were treated at 0, 10, and 100 nM, respectively. (b) Western blot analyses of TR3 protein expression in DHT-treated primary keratinocytes. Cells were treated at 0, 10, and 100 nM, respectively. Western blot analyses were performed in triplicate at least three times. (c) Transcriptional analysis of TR3 in DHT-treated HaCaT cells. Cells were treated at 0, 10, and 100 nM, respectively. (d) Transcriptional analysis of TR3 in DHT-treated primary keratinocytes. Cells were treated at 0, 10, and 100 nM, respectively. *P<0.05, ***P<0.001.
