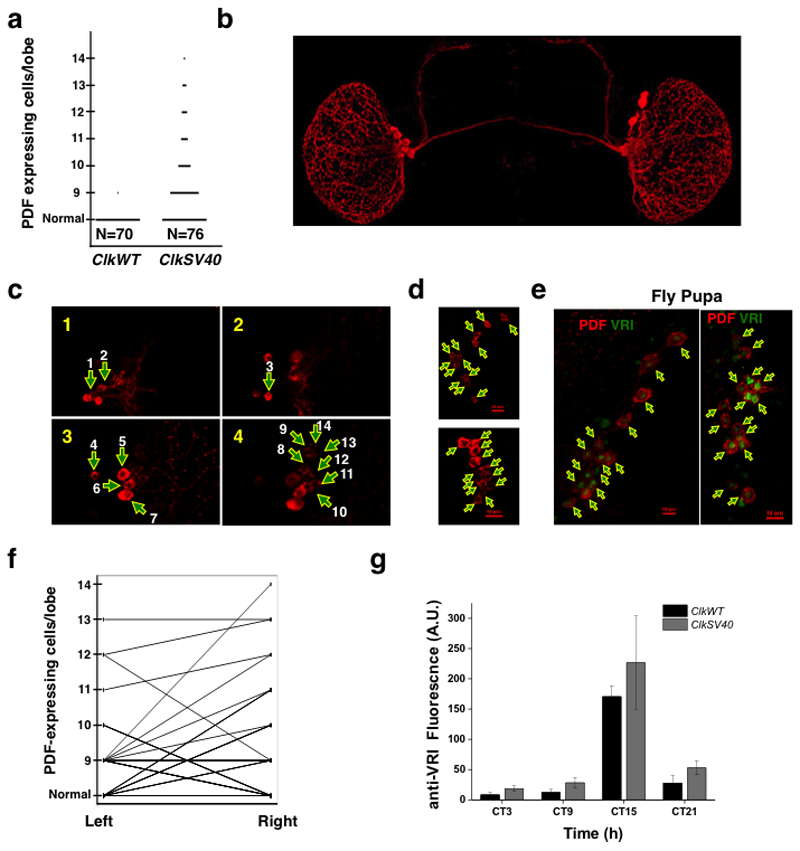
Figure 5. Stochastic development of the circadian system in ClkSV40 flies.
a. Number of PDF-positive cell bodies in ClkWT and ClkSV40 brains. Data is from the ClkSV40 (2-8) and ClkWT (1-1) fly strains. b. Representative example of a ClkSV40 fly brain in which the position of extra pdf-expressing cells can be visualized. c. Representative example of a ClkSV40 fly brain in which 14 pdf-expressing cells were observed in one of the brain hemispheres. Z stack of 3 images (each taken every 1 µm). Numbers in the upper left corner of each picture indicate the relative position of the Z stack. Arrows indicate the position of the pdf-expressing cells. d. Z stack (maximal projection) of 2 brain hemispheres of ClkSV40 flies immunostained for PDF showing the number of pdf-expressing cells (13 and 12 for the top and bottom brain hemispheres respectively). Arrows indicate the position of the pdf-expressing cells. Red scale bar indicates 10μm. e. Z stack (maximal projection) of 2 brains of ClkSV40 pupae immunostained for PDF (in red) and VRI (in green) showing the number of pdf-expressing cells (14 and 15 for the left and right images respectively). Arrows indicate the position of the pdf-expressing cells. Red scale bar indicates 10μm. f. Comparison of left and right hemispheres in ClkWT and ClkSV40 flies based on PDF immunofluorescent staining. g. Brain to brain variation in the levels of VRI (measured by IF) protein in the sLNvs at 4 time points (day 10 in DD), in ClkSV40 (line 2-8, red) and ClkWT (line 1-1, black) flies. See also Supplementary Figure 5, 6, 7 and 8 Supplementary Movies 3 and 4.

