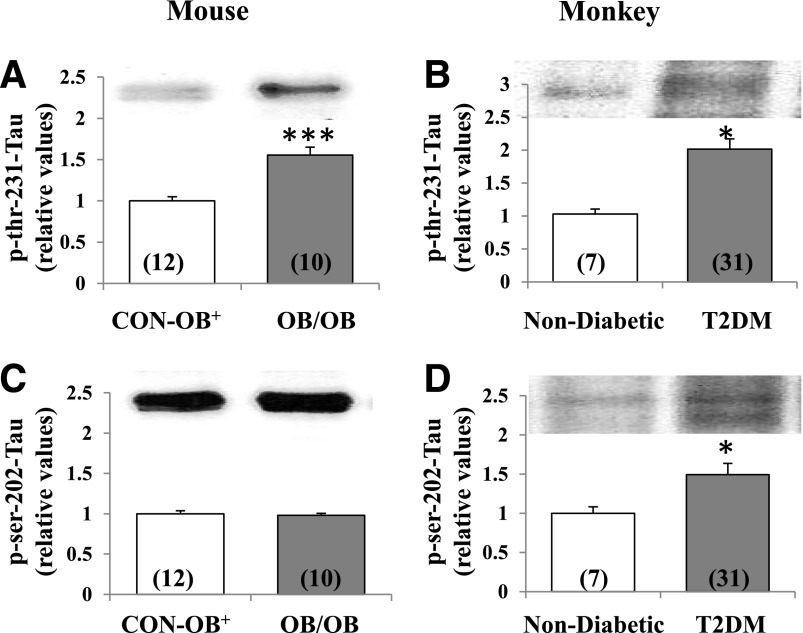
Figure 7.
Resting/basal phosphorylation of Thr-231-tau and Ser-202-tau in brains of lean control ob+ (CON-OB+) vs. ob/ob (OB/OB) mice (A and C), and nondiabetic vs. T2DM monkeys (B and D). Portrayed values of phosphoprotein levels are the mean ± SEM of (N) mice or monkeys. *P < 0.05 and ***P < 0.001 (ANOVA) for comparison of ob/ob mice or T2DM monkeys with lean ob+ control mice or nondiabetic monkeys.

