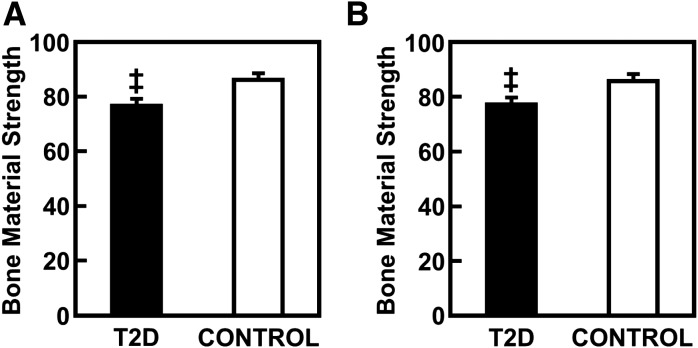
Figure 3.
Unadjusted (A) and BMI-adjusted (B) comparisons of bone material strength between patients with T2D and age-matched control subjects without diabetes. Values are shown as mean ± SE. ‡P < 0.001. Reprinted with permission from Farr et al. (61).

