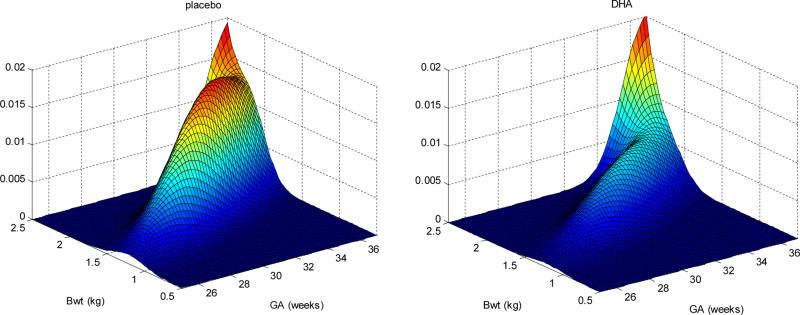
Figure 1.
Three-dimensional plot of fitted mixture model for both placebo and DHA. Back two walls represent 2.5 kg and 37 weeks cutpoints. Zeroing in on the third component, heights on the two figures are the same tells us the impact in lowering the risk of joint preterm birth and low birth weight with placebo relative to DHA.

