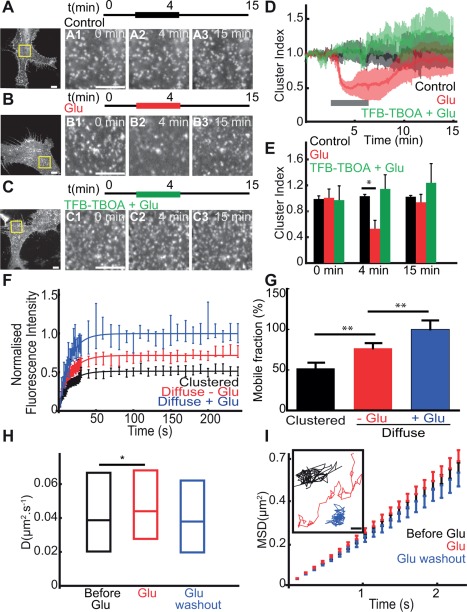
Figure 1.

Regulation of GLT‐1 surface diffusion by glutamate is transporter activity dependent. Astrocytes cultured alone and transfected with GFP‐GLT‐1 or GFP‐GLT‐1‐V5 and imaged live after 4 to 7 days expression. A–C: Representative time lapse imaging illustrates the GFP‐GLT‐1 clusters in control untreated astrocytes (A), treated with 100 μM Glu (B) or with 10 μM TFB‐TBOA + 100 μM Glu (C). Control images before treatment of a whole astrocyte (left panel). Schematic of recovery experiments. Regions boxed in left panels shown before treatment at 0 min, during treatment at 4min and after recovery at 15 min. Scale bars, 10 μm. D: Time course of GFP‐GLT‐1 de‐clustering (cluster index, V/V0) in astrocytes control untreated (black, n = 7 cells), Glu treated (green, n = 8 cells) and Glu + TFB‐TBOA treated (red, n = 7 cells) astrocytes. E: Cluster index at 0, 4, and 15 min. Loss of fluorescence in GFP‐GLT‐1 clusters at 4 min is significant compared with untreated control (P = 0.023) but is not significantly different at 15 min (P > 0.05). F: Fluorescence Recovery after Photobleaching. Quantification of GFP fluorescence intensity shows the recovery of diffuse GLT‐1 (red) is greater than clustered GLT‐1 (black) and that glutamate increases GLT‐1 recovery (blue). Data points represent an average of movies and are fitted with single exponentials (black, red, and blue lines). G: The mobile fraction, quantified as the final amount of recovered fluorescence presented as a percentage of the total bleached fluorescence, for diffuse GLT‐1 (black, n = 12 videos, 74.67 ± 4.890) is significantly increased compared with that for GLT‐1 in clusters (red, n = 9 videos, 51.92 ± 5.120; P = 0.002, t test) and GLT‐1 in glutamate is significantly increased compared with before treatment (blue, n = 6 videos, 100.2 ± 8.769; P = 0.01, t test). H: Instantaneous diffusion coefficients and (I) MSD versus time, MSDt plot, and representative single trajectories, Scale bar, 0.5 μm of QD‐tagged GFP‐GLT‐1‐V5. Control before treatment (black, median = 0.039 μm2/s; n = 579 trajectories), after 2 min with 100 μM glutamate (red, median = 0.044 μm2/s; n = 504 trajectories) and after drug washout (blue, median = 0.038 μm2/s; n = 276 trajectories). Median D is significantly increased upon 100 μM glutamate treatment (P = 0.005, Mann‐Whitney test) but is not significantly different after glutamate washout (P > 0.05).
