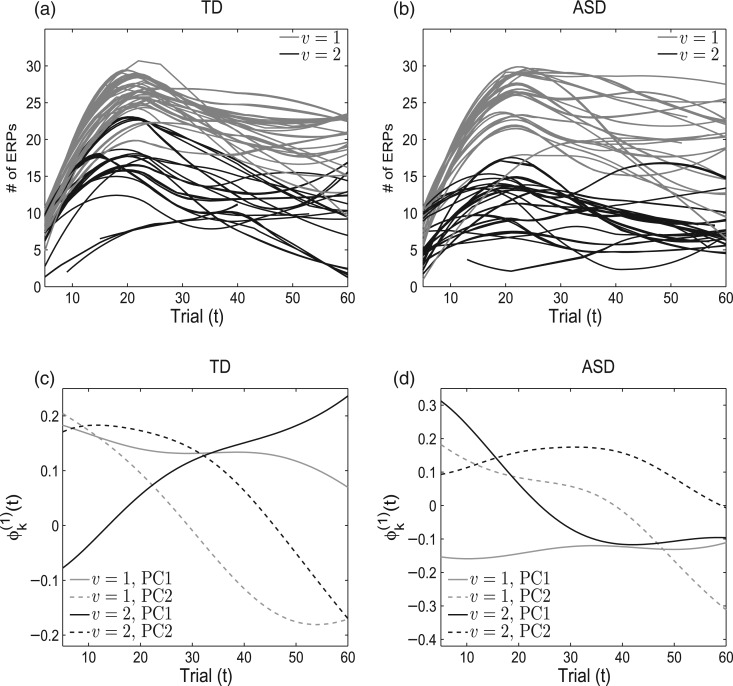
Fig. 2.
The number of averaged ERP trajectories from the two covariance subsets for the TD (a) and ASD (b) children. Estimated eigenfunctions for the two covariance subsets are given in plots (c) and (d) where the gray and black trajectories correspond to the covariance subset index and the solid and dashed lines represent the first and second principal components, respectively.

