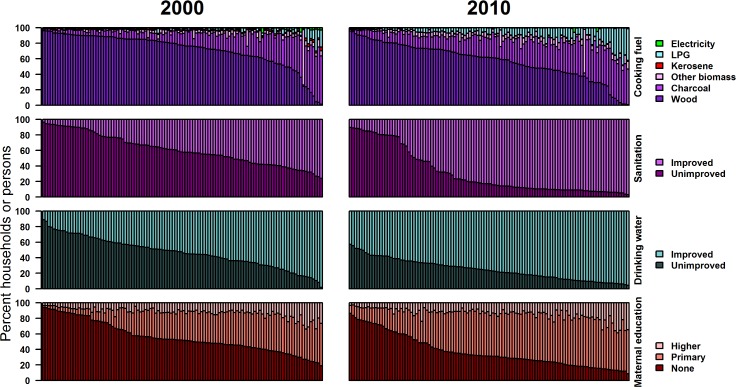
Fig 3. Distributions of household cooking fuel, sanitation facility, drinking water source, and maternal education by district in 2000 and 2010 (percent of households or persons).
Each bar represents one district, with districts ordered by decreasing prevalence of the worst category for each census.

