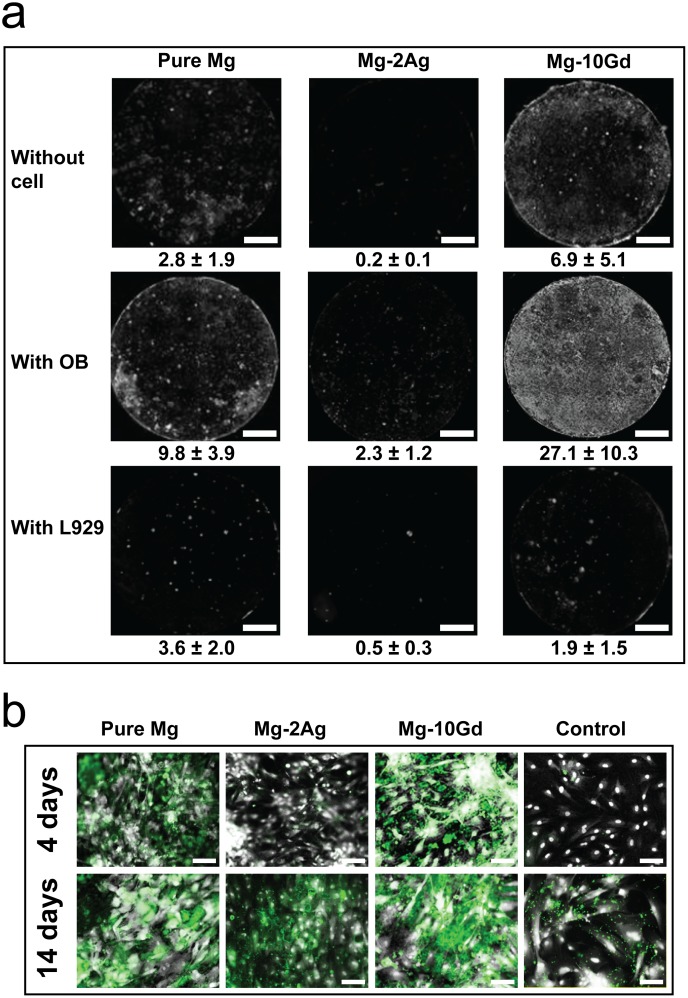
Fig 3. Biominerliazation detection by osteo-Image.
a): Fluorescent images of the stained hydroxyapatite (HA) on the different materials in monochromatic mode (i.e., mineralization appears white) after 14 days of immersion; without cells, with primary human osteoblasts, and with L929 mouse fibroblast cell line. The stained area is estimated in % of the shown field of view (values represent the mean of triplicate measurements for each condition). Scale bar represent 2 mm b): Fluorescent images at 20x magnification after 4 and 14 days of immersion. Cells stained with DAPI are shown in white/grey, and the mineralized matrix stained with Osteo-Image is shown in green. Scale bars represent 100 μm.

