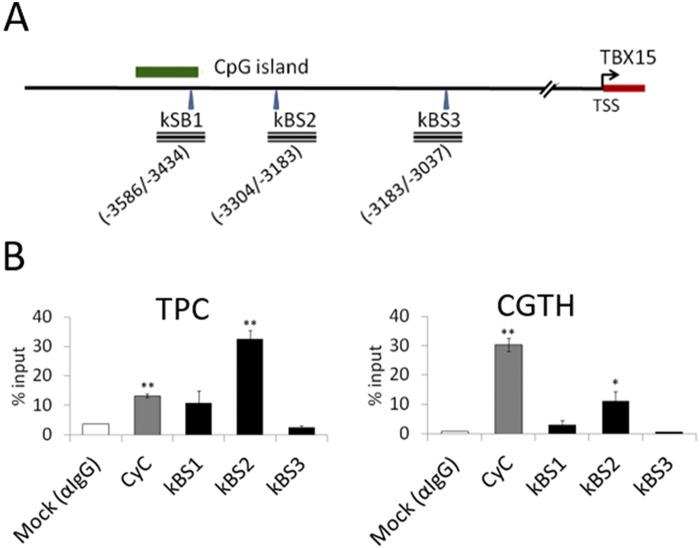
Fig 6. Chromatin inmunoprecipitation (ChIP) assays.
(A) The PCR amplified regions comprising the predicted NFκB binding sites (kBS1, kBS2 and kBS3) are indicated as rectangles, with location of these specific DNA segments indicated by numbers. (B) TPC and CGTH cells were treated with TNF-α and ChIP assays performed using IgG (mock) and NFκBp65 antibodies. Imnmunoprecipitated DNA was analyzed by qPCR with primers targeted to the predicted NFκB binding sites (kBS1, kBS2 and kBS3). The quantitative data reflect occupancy calculated as % input and represented as mean±SD of two independent experiments. *: P<0.05; **: P<0.01.

