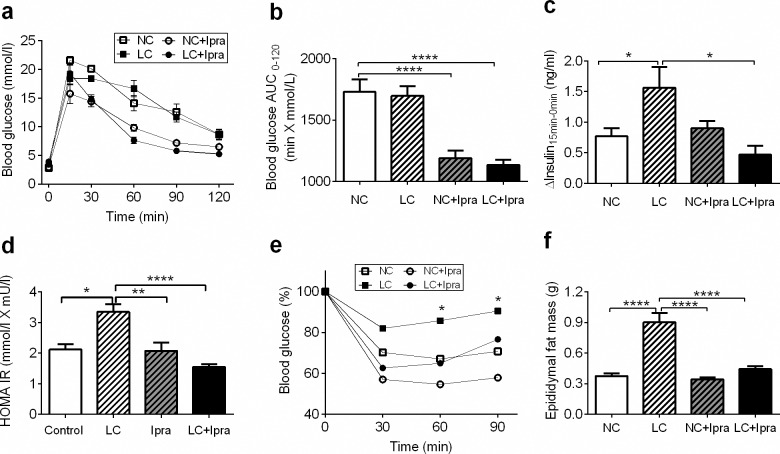
Fig 2. LCHD induced impaired glucose tolerance, insulin resistance and fat accumulation.
Blood glucose levels were measured after an oral glucose load (a). Blood glucose AUC in OGTT (b). Glucose stimulated insulin secretion (c) measured during OGTT (Δ-insulin = Insulin15min−Insulin 0min). HOMA IR (d) were calculated according to the formula: HOMA IR = Glucose (mmol/L) X Insulin (mU/L)/22.5. Blood glucose levels decrease after i.p. injection of insulin presented in % (e). Epididymal fat masses were measured at day 56 (f). n = 6–10. Data are presented as means ± SEM. *p < 0.05, **p < 0.01, ***p < 0.005, ****p < 0.0005 vs NC. White squares, NC; black squares, LC; white circles, NC+Ipra; black circles, LC+Ipra; white bars, NC; hatched white bars, LC; hatched grey bars, NC+Ipra; black bars LC+Ipra.

