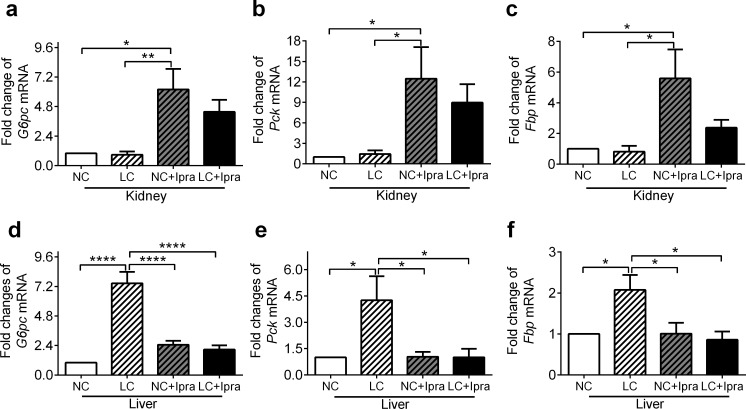
Fig 4. SGLT2i activates gluconeogenesis gene expression in the kidney, while LCHD activates expression in the liver.
mRNA expression of mouse G6pc, Pck, Fbp in the kidney (a, b, c) and the liver (d, e, f,) were determined by quantitative RT-PCR. The means ± SEM of mRNA levels related to the NC group are presented. n = 6–10. *p < 0.05, **p < 0.01, ****p < 0.0005 vs NC. White bars, NC; hatched white bars, LC; hatched grey bars, Ipra; black bars LC+Ipra.

