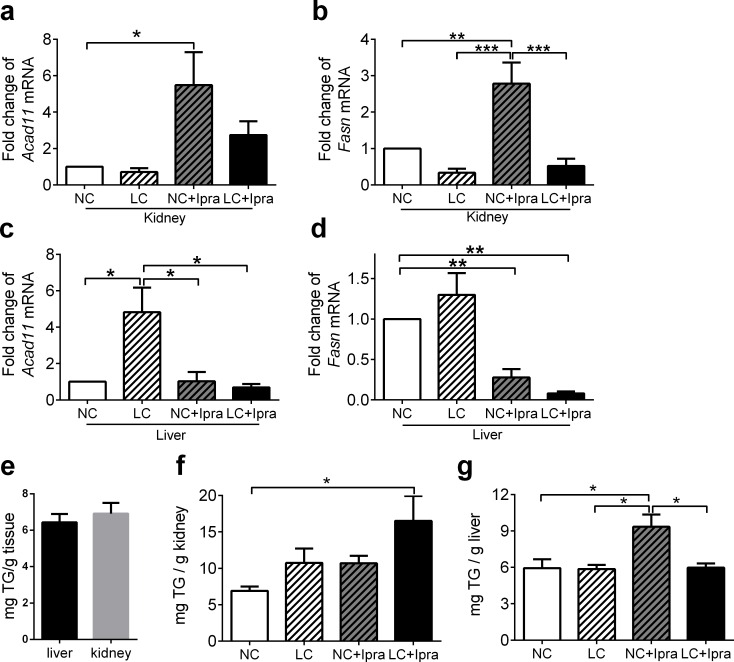
Fig 8. Ipragliflozin enhanced Acad11 and Fasn mRNA expression in the kidney.
Acad11 and Fasn mRNA expression in the kidney (a, b) and liver (c, d) were determined by quantitative RT-PCR. The means ± SEM of mRNA related to NC group are presented. TG content in the kidney and the liver (e) measured in the NC group. TG content in the kidney (f) and liver (g) in non-fasted mice. n = 6–10. *p < 0.05, **p < 0.01, ***p<0.005 vs NC. White bars, NC; hatched white bars, LC; hatched grey bars, NC+Ipra; black bars LC+Ipra.

