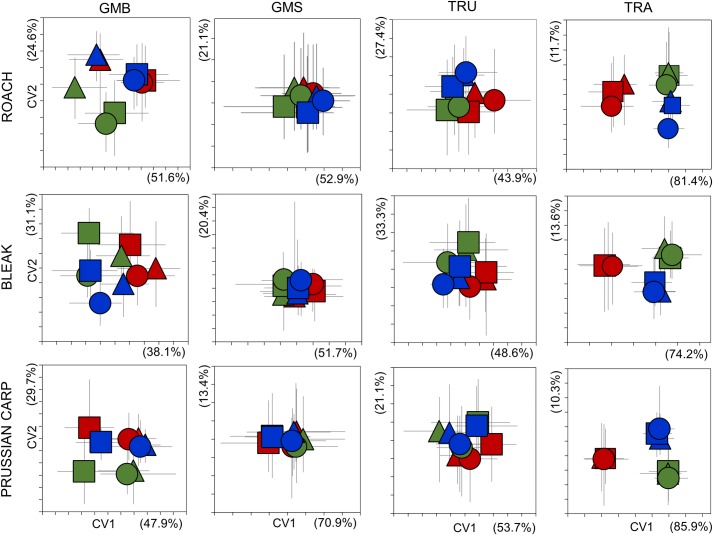
Fig 4. Canonical variate analysis scatterplots of standardised morphometric data derived from three species by three measurers using four different methods.
For clarity, only the group centroids are indicated, with vertical and horizontal whiskers indicating the maximum and minimum values. Each measurer is represented by a different colour (M1—red, M2—green, M3—blue), while each site is represented by a different shape (Site1—△, Site2—⬜, Site3—○). Numbers in parentheses show the variance on each axis.

