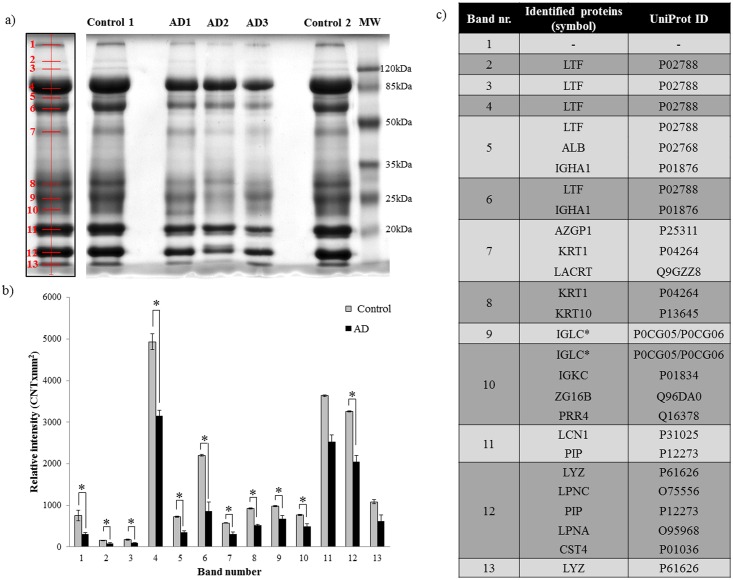
Fig 2. Changes in the tear proteome in AD.
a) Gel image of tear proteins from three AD and two control subjects. The left panel shows the representative band distribution detected with QuantityOne. b) Densitometric analysis of gel bands. The bars show mean values with the standard error of mean, grey bars indicate control group while the black bars indicate the AD group. * indicates p <0.05. c) List of identified proteins with the corresponding UniProt reference numbers. * indicates the presence of Ig λ, though the Ig λ-2 chain C region and Ig λ-3 chain C region of the identified peptides were undistinguishable. LTF: lactotransferrin, ALB: serum albumin, IGHA1: Ig α-1 chain C region, AZGP1: Zn-α2 glycoprotein, KRT1: keratin, type II cytoskeletal 1, LACRT: extracellular glycoprotein lacritin, KRT10: Keratin, type I cytoskeletal 10, IGLC: Ig λ chain C region, IGKC: Ig κ chain C region, ZG16B: zymogen granule protein 16 homolog B, PRR4: proline-rich protein 4, LCN1: lipocalin-1, PIP: prolactin-inducible protein, LYZ: lysozyme-C, LPNC: lipophilin C, LPNA: lipophilin A, CST4: cystatin S.

