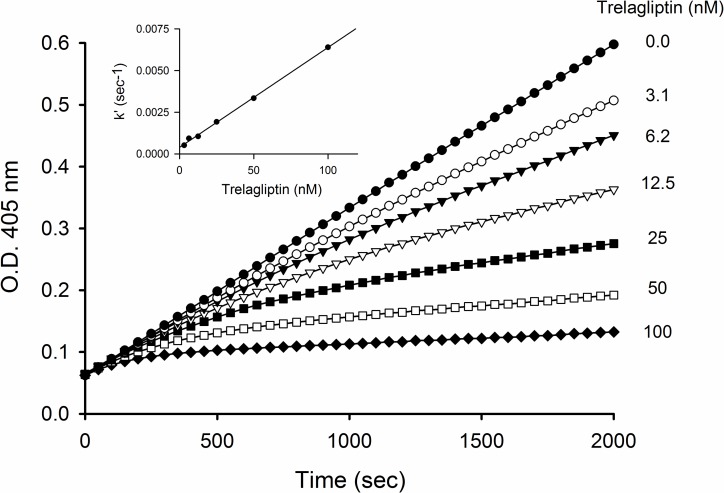
Fig 4. Time course of the reaction of DPP-4 in the absence or presence of different concentrations of trelagliptin.
Progress curves at 405 nm for pNA generation were recorded over 2000 sec using a 10 sec interval. Reaction was initiated with 1 nmol/L DPP-4 in the presence of 400 μmol/L GP-pNA substrate (approximately 4x Km) and varying concentrations of trelagliptin. Inset: Replot of apparent association rate constant, k’, against trelagliptin concentration used to estimate kon’ from the slope according to Eq 7.

