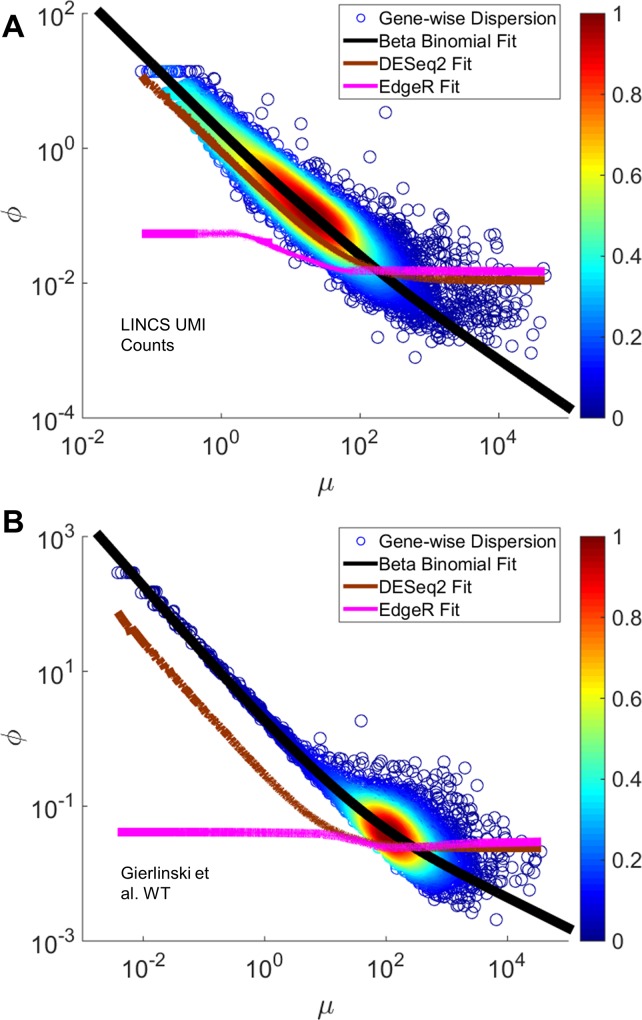
Fig 4. Comparing Beta-Binomial Dispersion with DESeq2 and EdgeR Dispersion Estimates.
Each panel reflects one of the following datasets tested: LINCS UMI (A) and Gierlinski WT (B). The remaining two datasets are shown in S3 Fig. Each panel shows a density scatter plot of mean versus dispersion values for each gene in each sample. The black line represents our fit showing the non-asymptotic relationship between mean and variance (see Methods). The brown line shows the DESeq2 dispersion fit while the magenta line shows the EdgeR dispersion fit (see Methods).

