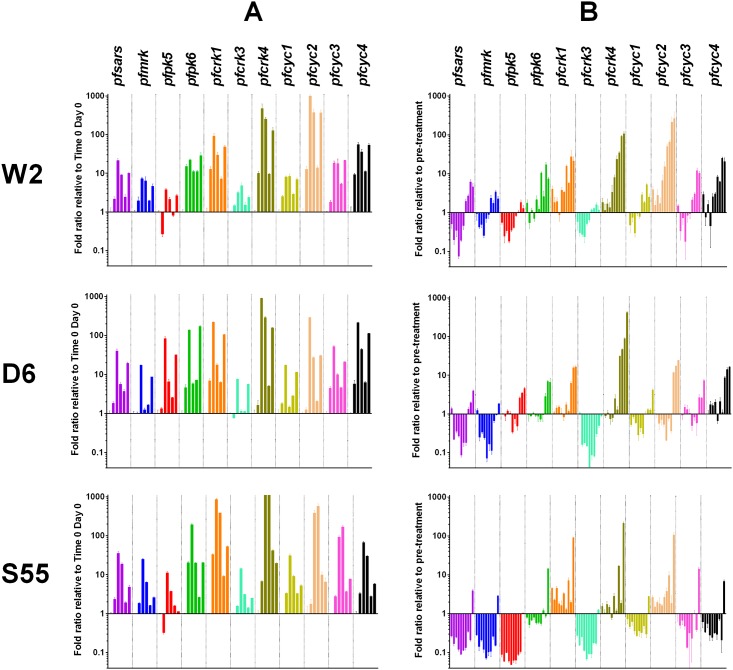
Fig 2. Transcription levels of CDK and cyclins (shown in different colours) in untreated and DHA treated P. falciparum W2, D6 and S55 parasites.
Panel A: untreated parasites. Transcription levels of each gene at 12, 24, 36, 48 and 60 h are grouped from left to right and are expressed as fold ratio relative to time 0. Panel B: DHA treated parasites. Transcription levels of each gene between day 1 and day 10 are grouped from left to right and are expressed as fold ratio relative to pre-treatment (time 0 h of untreated parasites on Day 0). Error bars represent standard error.

