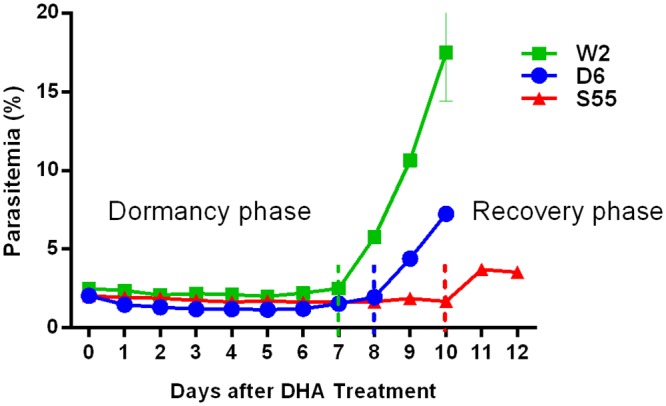
Fig 3. Dynamics of parasite density following DHA treatment of P. falciparum lines of W2, D6 and S55.

Parasitemia are determined by SYBR Green staining and FACS analysis. Dotted lines indicate boundaries between dormancy and recovery phase in each parasite line.
