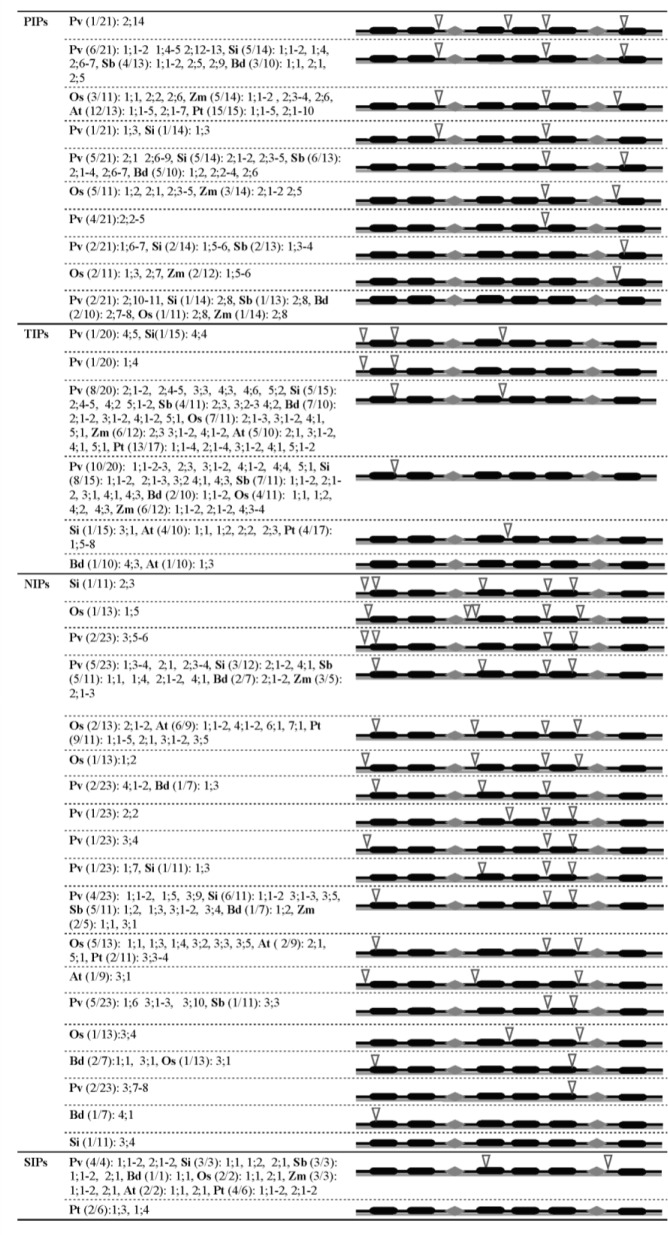
Fig 2. Gene structure of MIPs from grass plants, P. trichocarpa and A. thaliana.
Exon-intron organizations of MIP genes from grass plants are depicted for the PIP, TIP, NIP and SIP subfamilies. The exon-intron pattern observed in the majority of MIPs within a subfamily is shown in gray background. In the parenthesis, the number of MIPs having that pattern is indicated for each plant species. For example, Pv (6/21) indicates that 6 out of 21 PvPIPs have the same gene structure. The members of homologue(s) are mentioned after the parenthesis. The six TM regions are shown in black bars and the loops B and E are shown in diamond shapes. The intron positions are indicated by inverted triangles.

