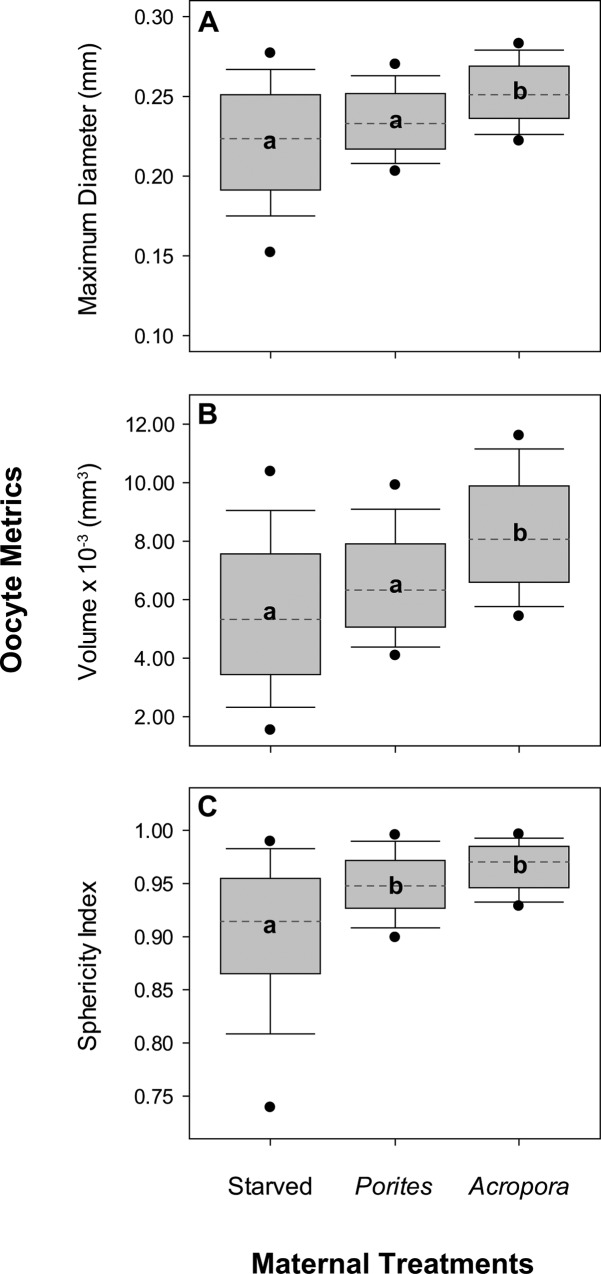
Fig 2. Size and shape of oocytes from females under different maternal nutrition treatments.
Plots show median (dashed line), 25th and 75th percentile range in the grey box, 5th and 95th percentile range as error bars, and outliers as solid circles for oocyte (A) maximum diameter, (B) volume, and (C) sphericity index (n = 100). Different letters are significantly different based on post hoc pairwise comparisons.

