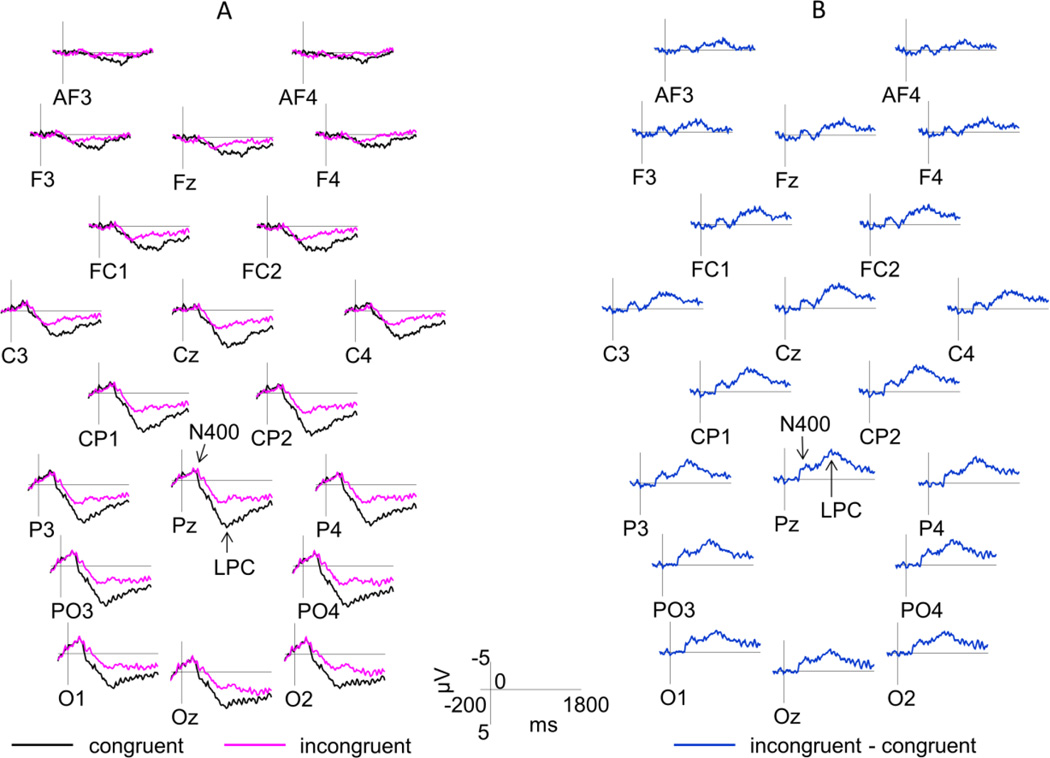
Figure 3. ERP Results.
Panel A shows an overlap between grand average waveforms elicited by congruent and incongruent silent articulations. Panel B shows a difference waveform produced by subtracting the ERPs elicited by incongruent articulations from the ERPs elicited by congruent articulations. Because the LPC mean amplitude was more positive to congruent articulations, it appears as a negative (rather than a positive) deflection in the difference waveform. The N400 and LPC components are marked on the Pz site. Only the midline and the mid-lateral sites are shown. Negative is plotted up. Time 0 indexes the onset of articulatory movements.

