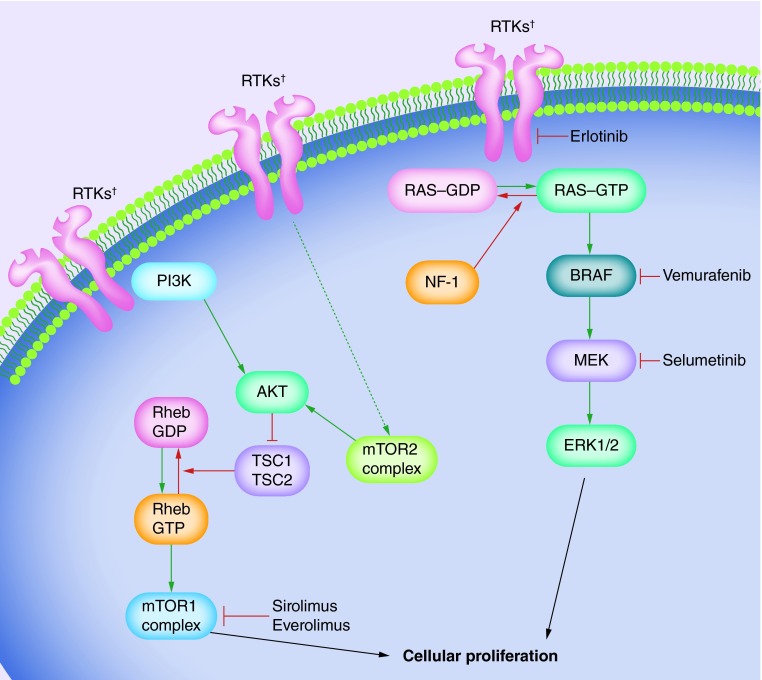
Figure 2. . BRAF and mTOR signaling pathways shown with targeted therapies.
Green arrows represent activating steps that ultimately lead to cellular proliferation. The dashed green arrow represents indirect activation. Red arrows represent de-activating steps that ultimately inhibit cellular proliferation. Blind-ended arrows represent inhibitory interactions.
†RTKs include EGFR, PDGFRA, NTRK2 and FGFR1.
RTK: Receptor tyrosine kinase.

