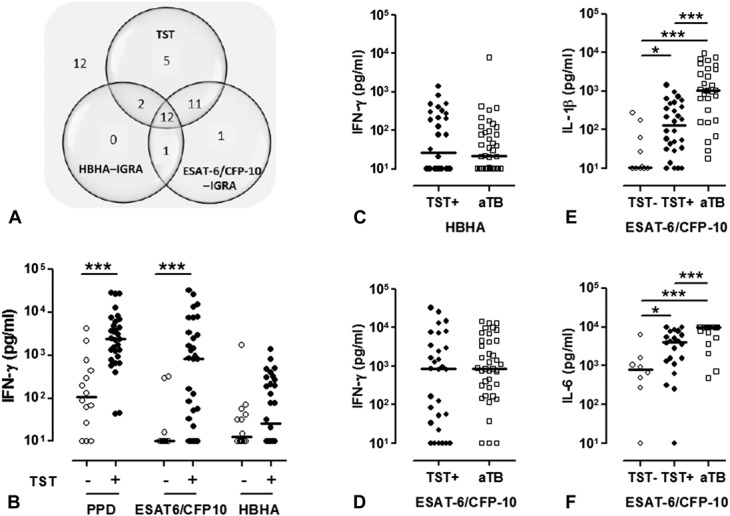
FIGURE 2.

TST and mycobacterial antigens–induced cytokine secretions in the HIV-uninfected control groups. A, HIV-uninfected subjects without aTB (n = 44) were classified according to positive TST, HBHA–IGRA, or ESAT-6/CFP-10–IGRA results. For each test, the number of positive subjects is noted in the corresponding circle of the Venn diagram, with overlaps representing matching results. Number of subjects with negative results for the 3 tests is indicated outside the diagram. B, PPD-induced, a mixture of ESAT-6–induced and CFP-10–induced, and HBHA-induced IFN-γ concentrations were measured in the 72-hour cell culture supernatants, and the results were compared between TST-negative and TST-positive HIV-uninfected subjects without aTB. White dots represent TST-negative subjects (n = 14) and black dots TST-positive subjects (n = 30). C, HBHA-induced and (D) ESAT-6/CFP-10–induced IFN-γ concentrations were measured in the 72-hour cell culture supernatants from HIV-uninfected TST-positive subjects without active TB (black dots, n = 30) and from HIV-uninfected patients with aTB (white squares, n = 39). ESAT-6/CFP-10–induced (E) IL-1β or (F) IL-6 concentrations were measured in the 72-hour cell culture supernatants from HIV-uninfected patients without active TB who were TST-negative (white dots, n = 14) or TST-positive (black dots, n = 25) and from HIV-uninfected patients with aTB (white squares, n = 29) patients. Individual background cytokine secretions were subtracted before being represented on the figures. Horizontal lines represent the medians of cytokine concentrations. *P ≤ 0.05; ***P ≤ 0.001.
