
FIGURE 3.
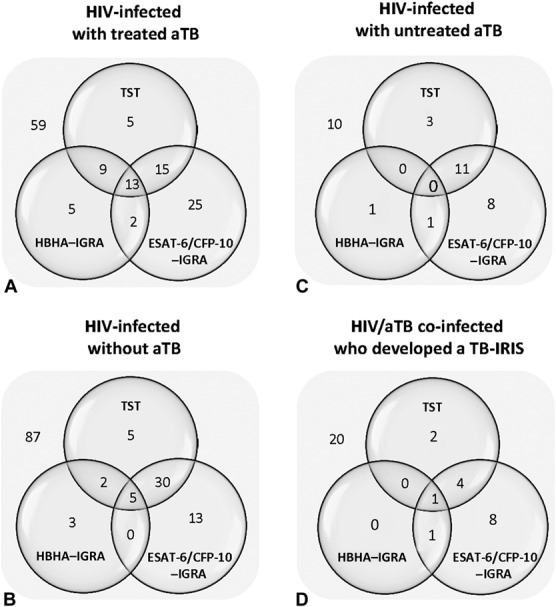
TST and IGRA characteristics of HIV-infected subgroups. Venn diagrams illustrated the numbers of TST and/or IGRA responders among (A) HIV-infected patients with treated aTB, (B) HIV-infected patients without aTB, (C) HIV-infected with untreated aTB, (D) and HIV/aTB coinfected patients who developed TB–IRIS. For each test, the number of subjects with a positive result is noted in the corresponding circle of the Venn diagram, with overlaps representing matching results. Number of subjects with negative results for the 3 tests is indicated outside the diagram.