
Figure 3.
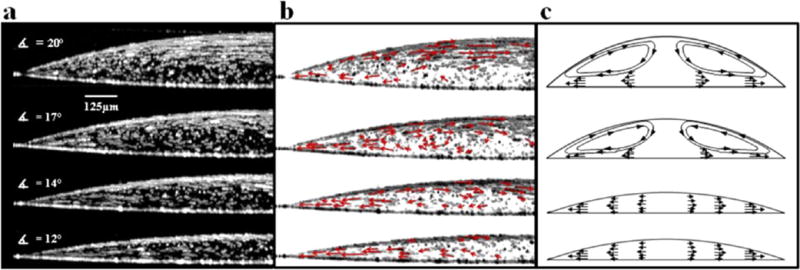
(a) Time-lapse composite of 200 consecutive OCT images of a 1 μL water drop containing 1 μm diameter carboxylated polystyrene particles (105 per μL) spanning 20 s of drop evaporation at four time points during evaporation (from top to bottom): t = 0.1tf, 0.3tf, 0.5tf, and 0.6tf. (b) Same images as a but with inverted contrast and superimposed vector lines. (c) Sketch of theoretical flow fields adapted from previously reported studies.10,11