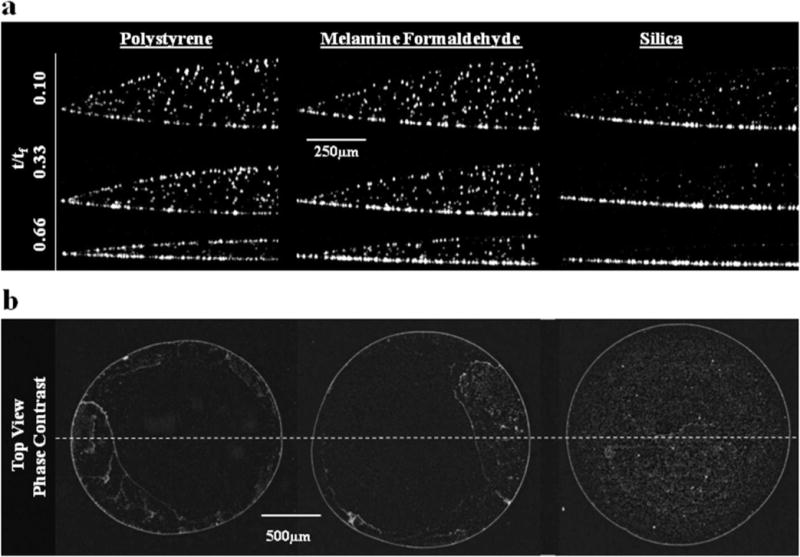
Figure 4.

(a) Time-dependent particle accumulation at the air–water interface decreases with an increase in particle density (Si < MF < PS). (b) Corresponding top-down micrographs showing the full diameter of the same dried 1 μL drops after complete evaporation show similar outer-ring structures and changes in deposition patterns in the drop interior at 2× magnification. Dotted line indicates the orientation of the corresponding OCT slices presented in a.
