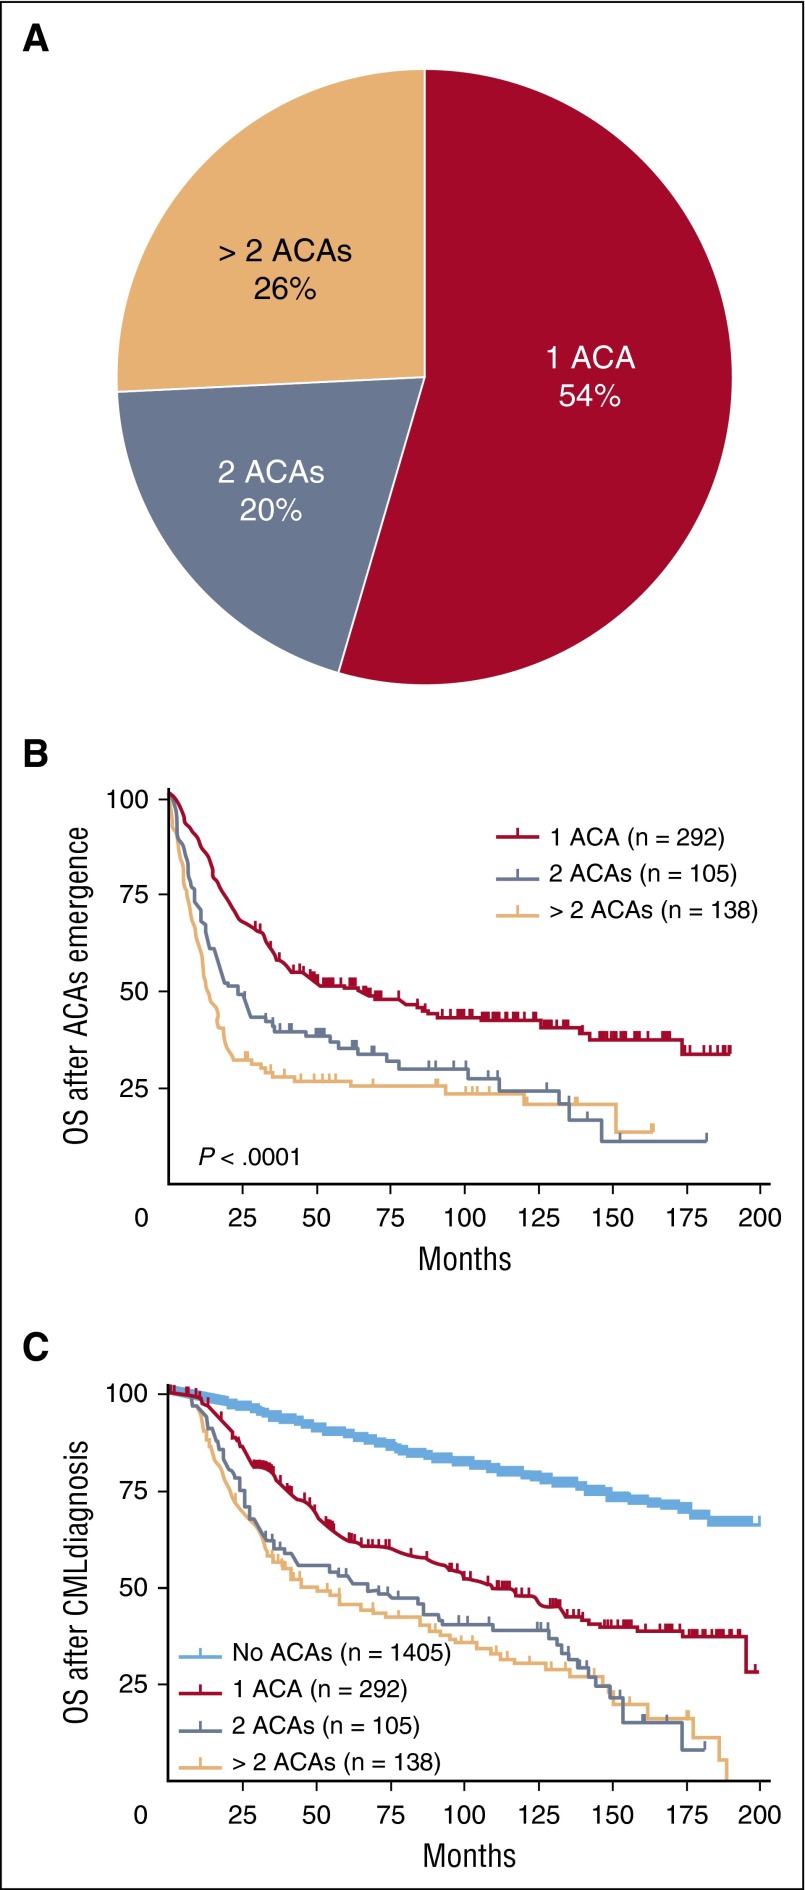
Figure 1.
The distribution of ACAs in CML and their impact on survival. Cases with ACAs were stratified based on the numbers of ACAs at the time of initial ACA emergence (A). The impact of ACAs on survival was analyzed. Date of ACAs emergence was used as the starting time point in panel B (OS after ACAs emergence), and date of CML diagnosis was used as the starting time point in panel C (OS after CML diagnosis). Of note, survival analysis in this figure included all stages of disease (CP, AP, and BP).

