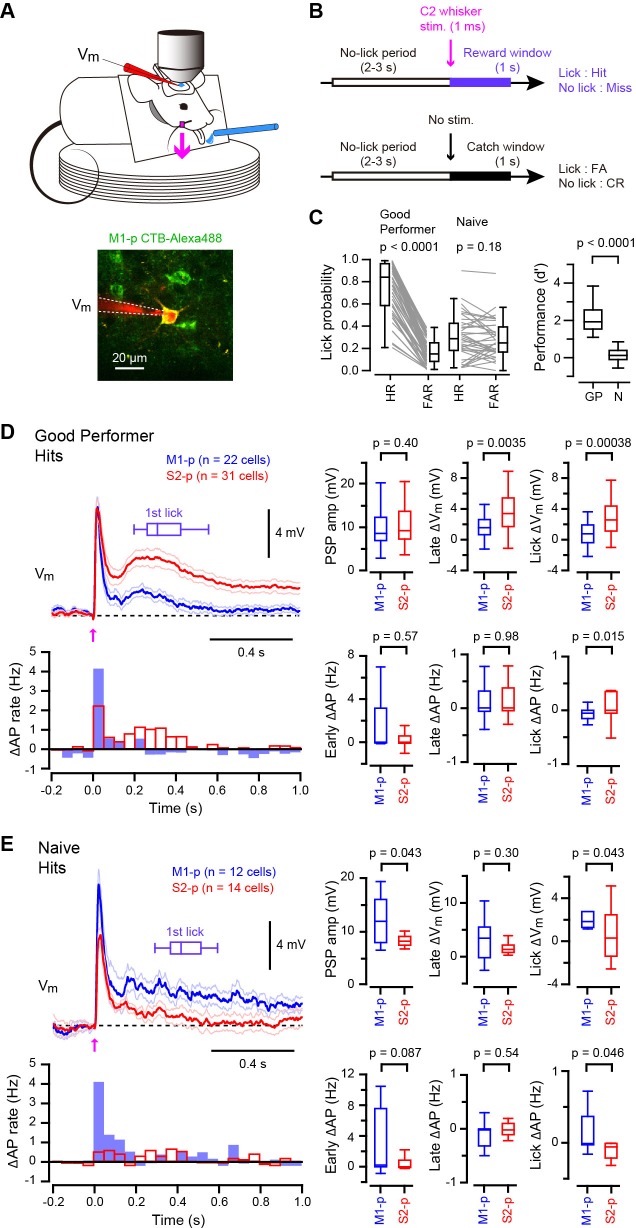
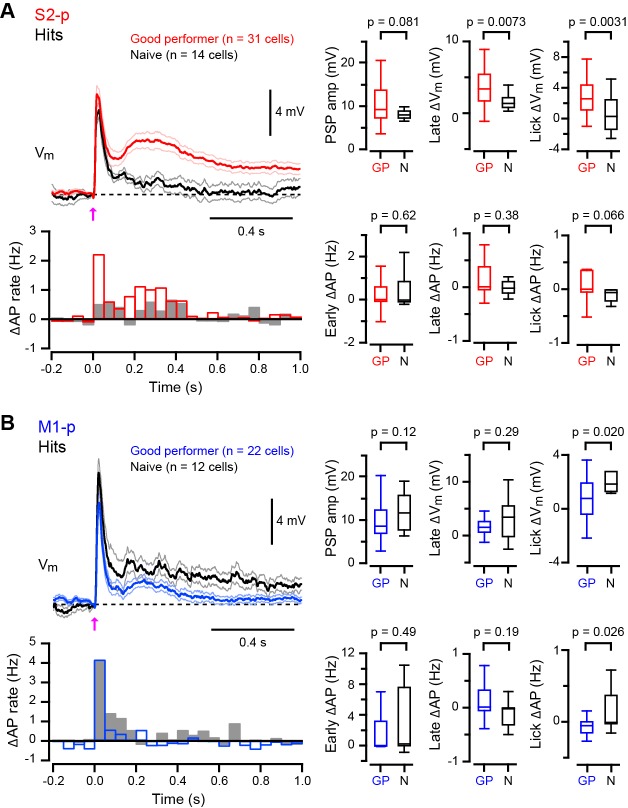
Figure 1. Target-specific Vm dynamics in S1 projection neurons during task performance.
(A) Top, the experimental setup. Bottom, a representative two-photon image of a CTB-labeled M1-p neuron (green) with a recording pipette (red). (B) Detection task trial structure (FA: false alarm, CR: correct rejection). (C) Behavioral performance during whole-cell recordings (HR: hit rates, FAR: false alarm rates, GP: ‘Good performer’, N: ‘Naive’). (D, E) Left, grand average changes in Vm (thick line: mean, thin lines: ± sem) and action potential (AP) firing rate for hit trials recorded from S2-p neurons (red) and M1-p neurons (blue) in ‘Good performer’ (D) and ‘Naive’ (E) mice (Arrow: 1 ms stimulation of the C2 whisker). A box plot indicates reaction time (1st lick). Right, box plots for postsynaptic potential (PSP) amplitude, secondary late Vm depolarization quantified at 0.05–0.25 s, Vm depolarization during the lick period (at 0.25–1.0 s), and evoked AP rates at early (0–0.05 s), late (0.05–0.25 s) and lick (0.25–1.0 s) periods.
DOI: http://dx.doi.org/10.7554/eLife.15798.003

