. 2016 Jun 21;5:e15266. doi: 10.7554/eLife.15266

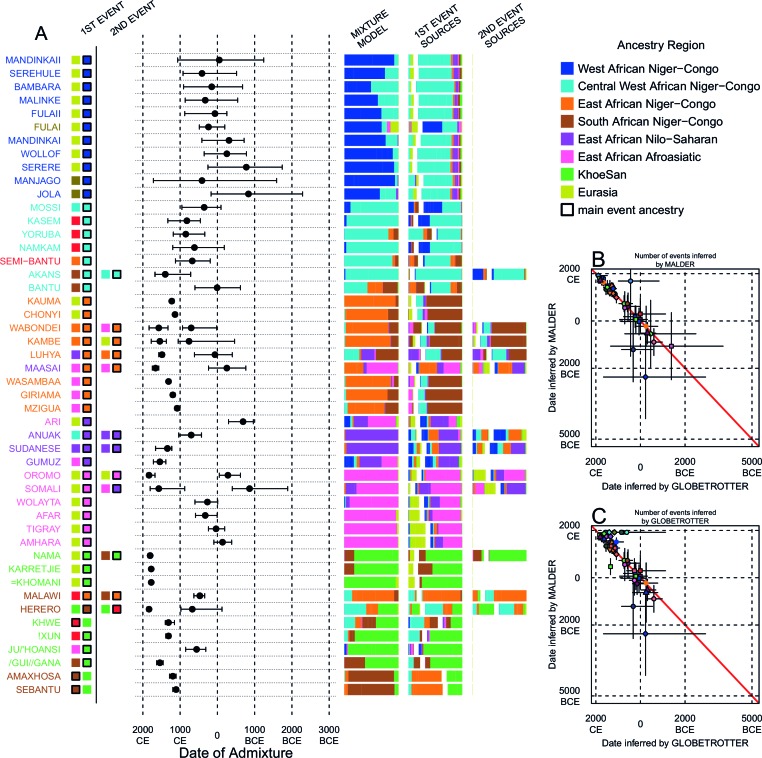
Figure 4. Inference of admixture in sub-Saharan African using GLOBETROTTER.

(A) For each group we show the ancestry region identity of the best matching source for the first and, if applicable, second events. Events involving sources that most closely match FULAI and SEMI-BANTU are highlighted by golden and red colours, respectively. Second events can be either multiway, in which case there is a single date estimate, or two-date in which case 2ND EVENT refers to the earlier event. The point estimate of the admixture date is shown as a black point, with 95% CI shown with lines. MIXTURE MODEL: We infer the ancestry composition of each African group by fitting its copying vector as a mixture of all other population copying vectors. The coefficients of this regression sum to 1 and are coloured by ancestry region. 1ST EVENT SOURCES and 2ND EVENT SOURCES show the ancestry breakdown of the admixture sources inferred by GLOBETROTTER, coloured by ancestry region as in the key top right. (B) and (C) Comparisons of dates inferred by MALDER and GLOBETROTTER. Because the two methods sometimes inferred different numbers of events, in (B) we show the comparison based on the inferred number of events in the MALDER analysis, and in (C) for the number of events inferred by GLOBETROTTER. Point symbols refer to populations and are as in Figure 1 and source data can be found in Figure 4—source data 1.

DOI: http://dx.doi.org/10.7554/eLife.15266.026

Figure 4—source data 1. Results of the main GLOBETROTTER analysis.
Analysis refers to whether the main or masked analysis was used to produce the final result. Admixture P-values are based on 100 bootstrap replicates of the NULL procedure. Our resulting inference, res can be: 1D (two admixing sources at a single date); 1MW (multiple admixing sources at a single date); 2D (admixture at multiple dates); NA (no-admixture); U (uncertain). max(R1) refers to the R2 goodness-of-fit for a single date of admixture, taking the maximum value across all inferred coancestry curves. FQ1 is the fit of a single admixture event (i.e. the first principal component, reflecting admixture involving two sources) and FQ2 is the fit of the first two principal components capturing the admixture event(s) (the second component might be thought of as capturing a second, less strongly-signalled event. M is the additional R2 explained by adding a second date versus assuming only a single date of admixture; we use values above 0.35 to infer multiple dates (although see Supplementary Text for details). As well as the final result, for each event we show the inferred dates, αs and best matching sources for 1D, 1MW, and 2D inferences. Inferred dates are in years(+ 95% CI; B=BCE, otherwise CE); the proportion of admixture from the minority source (source 1) is represented by α. Date confidence intervals are based on 100 bootstrap replicates of the date inference
DOI: 10.7554/eLife.15266.027
Figure 4—source data 2. Results of the main GLOBETROTTER analysis.
Analysis refers to whether the main or masked analysis was used to produce the final result. Admixture P-values are based on 100 bootstrap replicates of the NULL procedure. Our resulting inference, res can be: 1D (two admixing sources at a single date); 1MW (multiple admixing sources at a single date); 2D (admixture at multiple dates); NA (no-admixture); U (uncertain). max(R1) refers to the R2 goodness-of-fit for a single date of admixture, taking the maximum value across all inferred coancestry curves. FQ1 is the fit of a single admixture event (i.e. the first principal component, reflecting admixture involving two sources) and FQ2 is the fit of the first two principal components capturing the admixture event(s) (the second component might be thought of as capturing a second, less strongly-signalled event. M is the additional R2 explained by adding a second date versus assuming only a single date of admixture; we use values above 0.35 to infer multiple dates (although see Supplementary Text for details). As well as the final result, for each event we show the inferred dates, αs and best matching sources for 1D, 1MW, and 2D inferences. Inferred dates are in years(+ 95% CI; B=BCE, otherwise CE); the proportion of admixture from the minority source (source 1) is represented by α. Date confidence intervals are based on 100 bootstrap replicates of the date inference
DOI: 10.7554/eLife.15266.028

Figure 4.

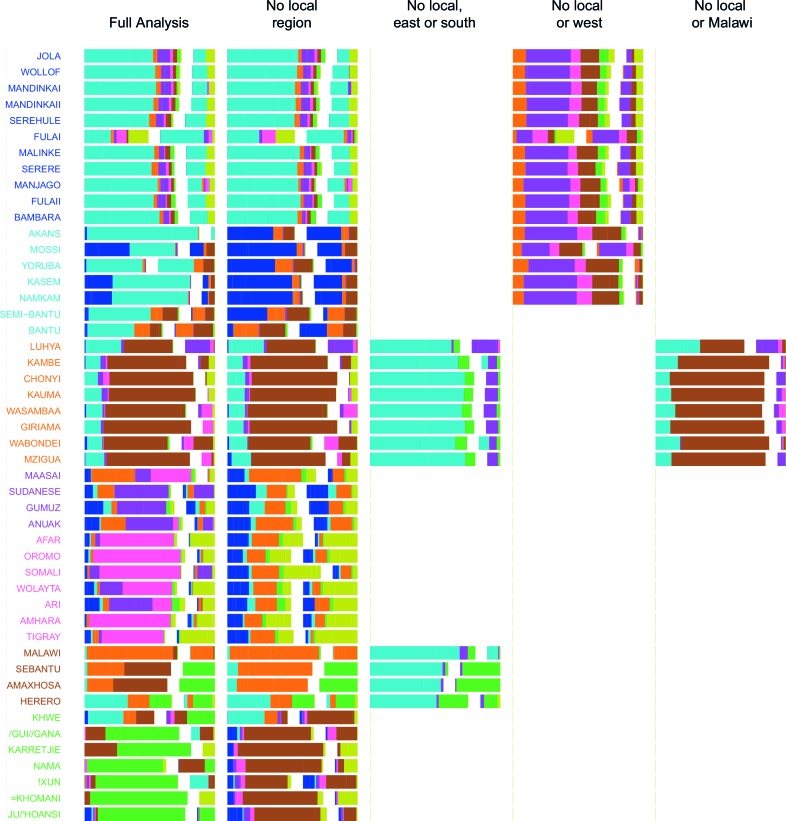
Figure 4—figure supplement 1. Admixture source inference by GLOBETROTTER after sequentially removing local surrogates from the analysis.

Figure 4—figure supplement 1.

In addition to the Full analysis, we show the inferred composition of admixture sources for different, restricted surrogate analyses. Components and y-axis labels are coloured by ancestry region. In each case we show admixture sources inferred by GLOBETROTTER for a single date of admixture.
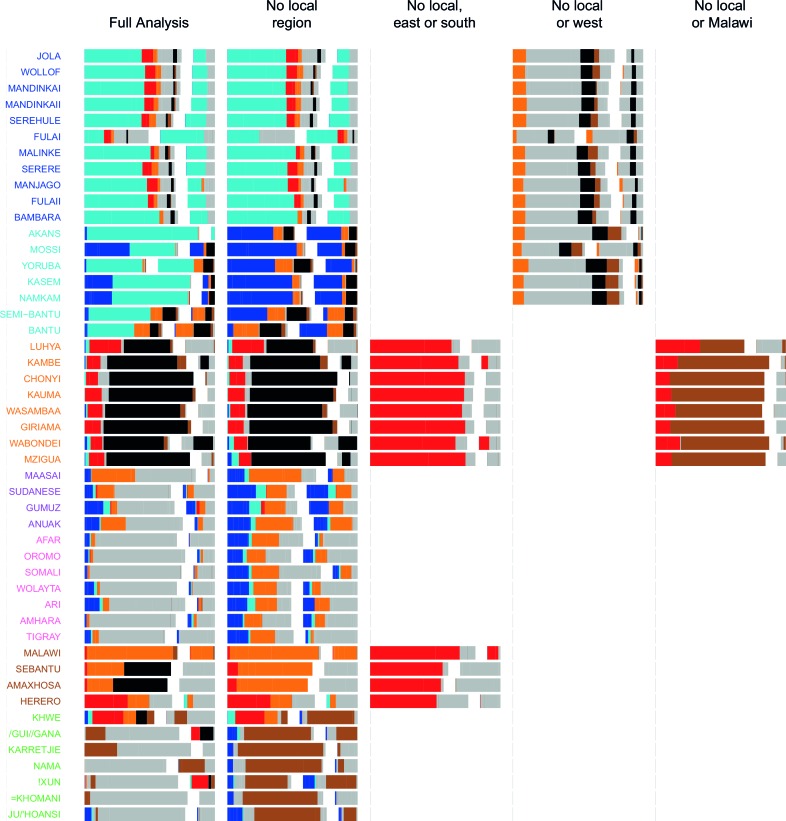
Figure 4—figure supplement 2. Admixture source inference by GLOBETROTTER after sequentially removing local surrogates from the analysis.

Figure 4—figure supplement 2.

The results are the same as Figure 4—figure supplement 1, but only Niger-Congo speaking groups are coloured. We highlight Malawi components in black, and Cameroon (Bantu and Semi-Bantu) in red.