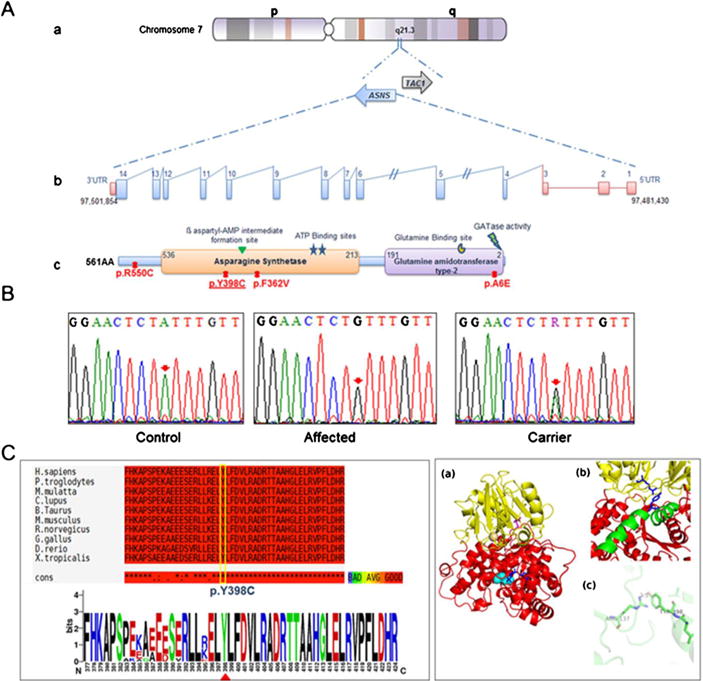
Fig. 2.

Schematic representation and molecular analysis of ASNS gene. a-(a to b) genomic organization of the ASNS gene. a to c. Protein representation of functional domain of the asparagine synthetase enzyme along with the corresponding position of all reported mutations. The identified mutation in this study is underlined b. Chromatograms of DNA sequence changes in the ASNS gene. A homozygous c.1193A>C mutation was identified in the affected child, which results in the substitution of p.Y398C. Both parents are carrier for this mutation. c. Schematic representation of amino acid sequence alignment of p.Y398C in different orthologues. c to a Alignment conversation was compiled using T-coffee online website (http://tcoffee.crg.cat/). C to b Logo was generated using WebLogo (weblogo.berkeley.edu) (Crooks et al. 2004). d. Humanized model of ASNS protein. a The cartoon representation shows that the protein is divided into distinct N-terminal domain (represented in yellow color) and C-terminal domain (represented in red color). The glutamine (represented as sticks in magenta color) is bound in N-terminal domain while AMP (represented as sticks in blue color) is bound in C-terminal domain. The cyan spheres represent the site for cation binding. b The protein consists of a long helix (represented in green color) which is distorted in the middle. Y398 (blue sticks) lies on this long helix and is at the interface of N-and C-terminal domain. R137 (blue sticks) lies in N-terminal domain and is within hydrogen bonding distance of Y398. c Representation of R137 and Y398 hydrogen bonding indicating that it is a key residue between the domain-domain interactions which contains the two active sites of the enzyme
