
FIGURE 3.
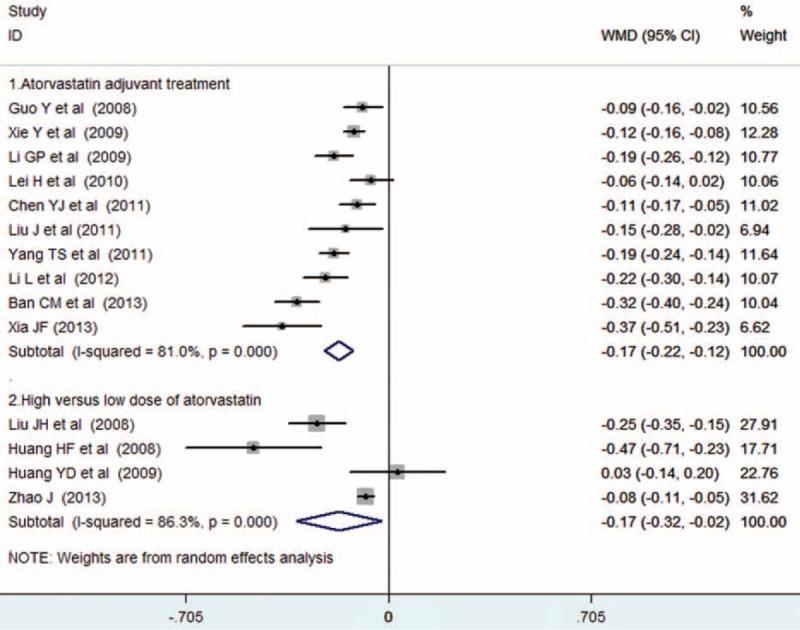
Forest plots showing weighted mean differences with 95% confidence intervals for reduction in carotid intima–media thickness in a random effects model.
Official websites use .gov
A
.gov website belongs to an official
government organization in the United States.
Secure .gov websites use HTTPS
A lock (
) or https:// means you've safely
connected to the .gov website. Share sensitive
information only on official, secure websites.
Forest plots showing weighted mean differences with 95% confidence intervals for reduction in carotid intima–media thickness in a random effects model.