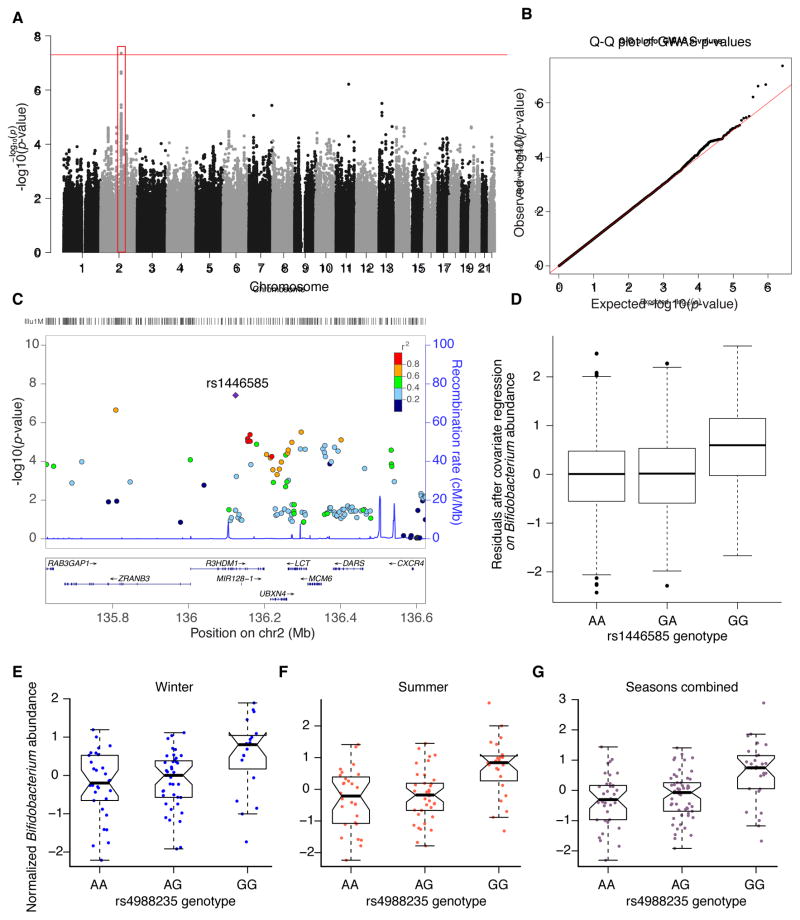
Figure 4. Relative abundances of the heritable genus Bifidobacterium are associated with genetic variants in the genomic locus containing the gene LCT.
(A) Genome-wide Manhattan plot: the x-axis represents the chromosome and position along the chromosome, and the y-axis is −log of the P-value for the association of the SNP (each dot) with the genus Bifidobacterium. The red box highlights the associated locus on chromosome 2 that contains the gene LCT. (B) Quantile-Quantile (Q-Q) plots of the P-values. The Q-Q plot measures deviation from the expected distribution of P-values. The diagonal (red) line represents the expected (null) distribution. (C) Close-up plots of a 1 Mb window around the SNP with the highest association, the coloring of the points represents r2 between a SNP and the SNP with the highest association in the locus (rs1446585, denoted by the purple diamond); r2 is calculated from the 1000 Genomes data on the CEU population. (D) Box-plot of Bifidobacterium normalized abundances within each genotype at the most strongly associated SNP (rs1446585; P-value = 4.38 × 10⁻⁸), the y-axis depicts the residuals from linear regression of the Box-Cox transformed abundances with the covariates (the number of 16S rRNA gene sequences per sample, age, gender, shipment date, collection method (postal or visit), ID of technician performing DNA extraction). (E–G). Normalized Bifidobacterium abundance within each genotype at the lactase persistence-associated SNP (rs4988235) in the Hutterite dataset. (E) Winter samples (P-value = 0.02). (F) Summer samples (P-value = 0.001). (G) Seasons combined (P-value = 4 × 10 −5). See also Table S5 and Table S6.

