
Fig. 3.1.
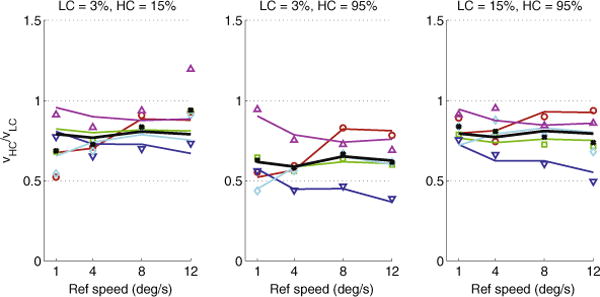
Mean ratio of speeds of the high (νHC) and low-contrast (νLC) gratings at the point of subjective equality (PSE), plotted as a function of speed, separately for each contrast condition. Points represent experimental data (as in Fig. 2.1); lines represent predictions of the fitted Bayesian model. Color represents individual subjects; black represents the combined data from all subjects. (For interpretation of the references to color in this figure legend, the reader is referred to the web version of this article.)