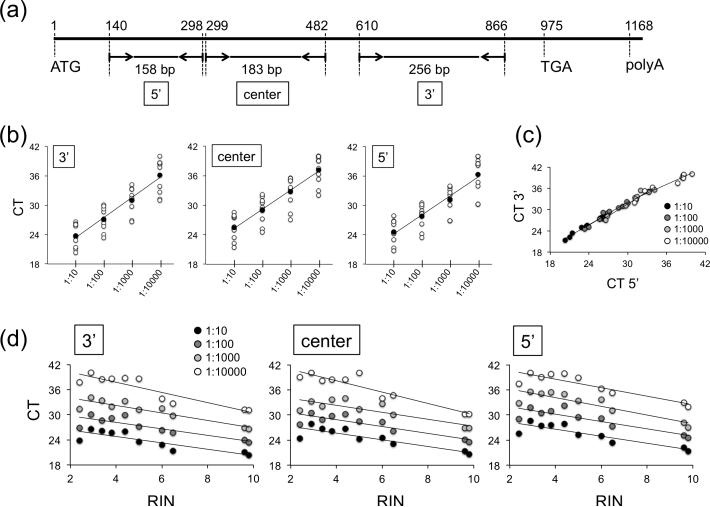
Fig. 3.
PCR analysis of full-length CYC1 cDNA. (a) Schematic of primer design covering the 5′, center, and 3′ regions of the CYC1 mRNA between the ATG (start) and TGA (stop) codon. Numbers indicate nucleotide positions. (b) CT values for 10 samples (8 brains and 2 fibroblast controls (#205 and #231)) show linear amplification of PCR products in 4 dilutions along the entire cDNA. RINs for individual samples are 2.4 (#06885), 2.9 (#17270), 3.4 (#15490), 3.8 (#08067), 4.4 (#02315), 5.0 (#17717), 6.0 (#04630), 6.5 (#02646), 9.6 (#205), and 9.8 (#231) (see Fig. 2). The linear regression curves depict average CT values for all samples in each dilution. 3′: r = 0.99064, p = 0.0094; center: r = 0.99712, p = 0.0027; 5′: r = 0.98567, p = 0.0144. (c) Linear regression curve showing distribution of CT values for the 3′ and 5′ region demonstrate positive correlations in all dilutions. (d) RINs negatively correlate with CT values. The r and p values in panels (c) and (d) are summarized in Table 2.

