
Figure 12.
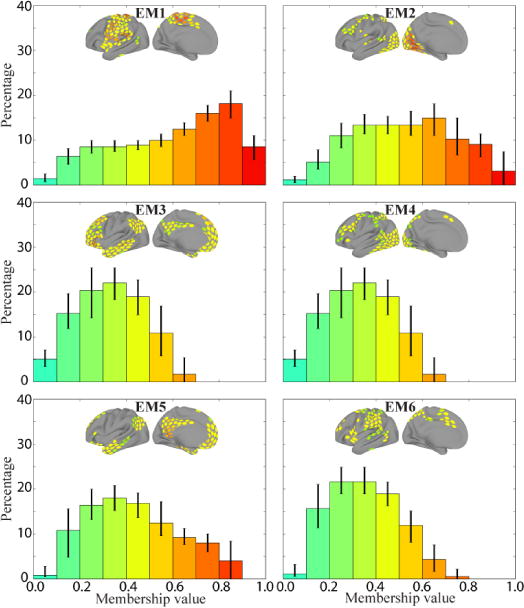
Frequency histograms of membership values for each of the six overlapping communities during the emotion task. Each histogram depicts the median value in each bin for that community across 5,000 iterations (error bars show the of 25th–75th percentile range). The colors of the bars correspond to the range of membership values shown in the brain insets.