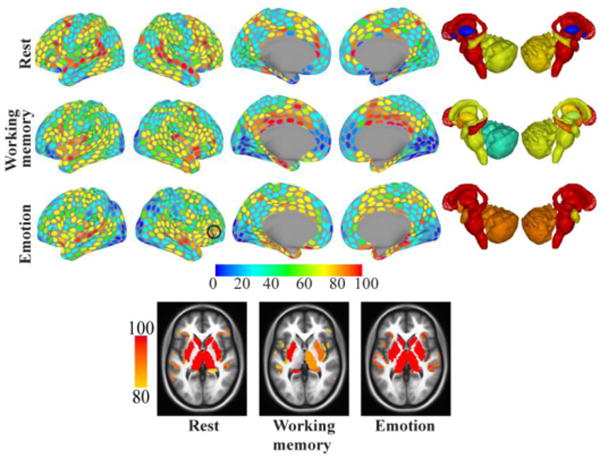
Figure 14.

Bottleneck bridges. Bridgeness scores for each region and condition (top: resting state, middle: working memory, bottom: emotion). Colors indicate the percentile of the ROI’s median score across 5000 iterations (for example: regions colored red had bridgeness scores around the 90th percentile or above). Black contours indicate regions discussed in the text. Bottom row: Horizontal slices at illustrating strong bridges in the anterior insula.
