
Figure 17.
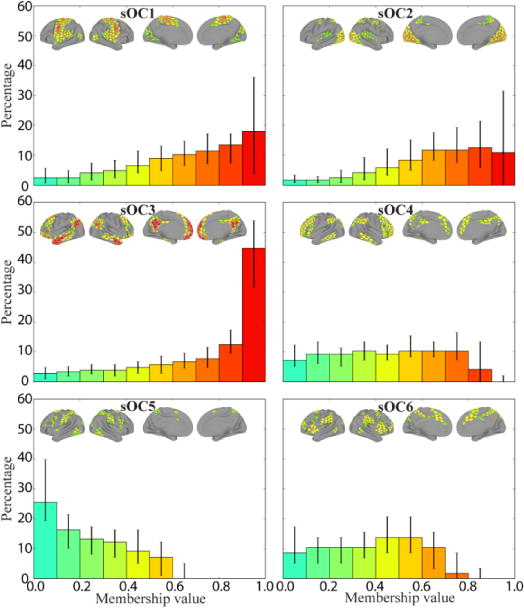
Frequency histograms of membership values for overlapping communities estimated at the individual level during rest. Bins show median values across 94 subjects (error bars show the of 25th–75th percentile range). Brain insets show median membership values across subjects (thresholded at 0.1 for illustration). The colors of the bars correspond to the range of membership values shown in the brain insets.