
Figure 4.
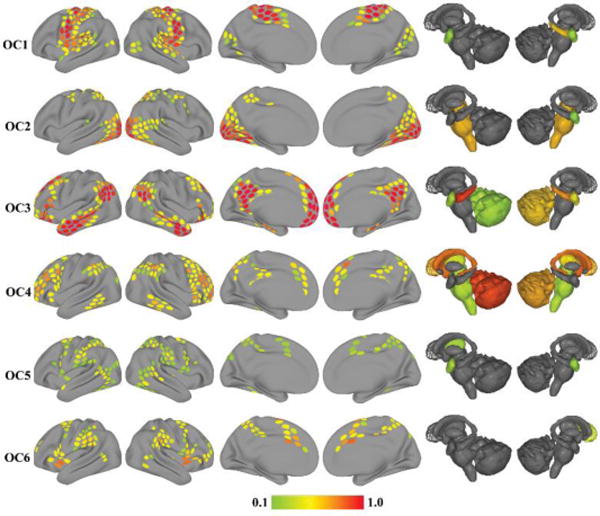
Overlapping communities (OC) detected during rest. Each row depicts one of the six overlapping communities extracted with the mixed-membership model. The color of cortical and subcortical regions reflects the median membership value of each region to each community across 5,000 iterations. Membership values are thresholded at 0.1 for illustration.