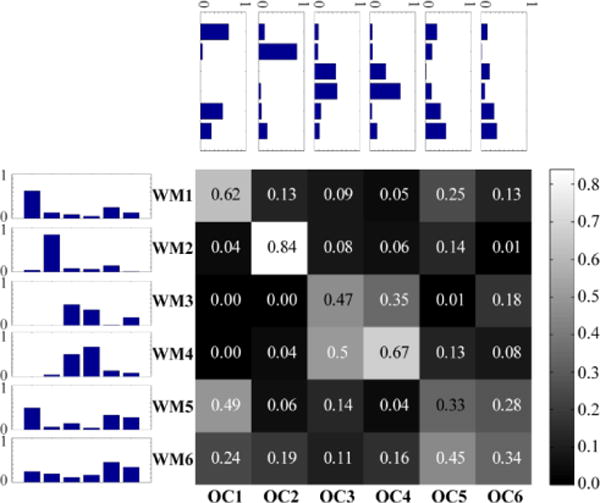
Figure 9.

Cosine similarity between overlapping communities at rest (OC1–OC6) and during the working memory task (WM1–WM6). The matrix displays the median cosine similarity between each WM and OC network across 5,000 iterations. Given that the community membership vectors do not contain negative values, the cosine similarity scores range from zero (orthogonal) to one (identical). Side and top insets represent similarity scores as bar plots across rows and columns, respectively.
