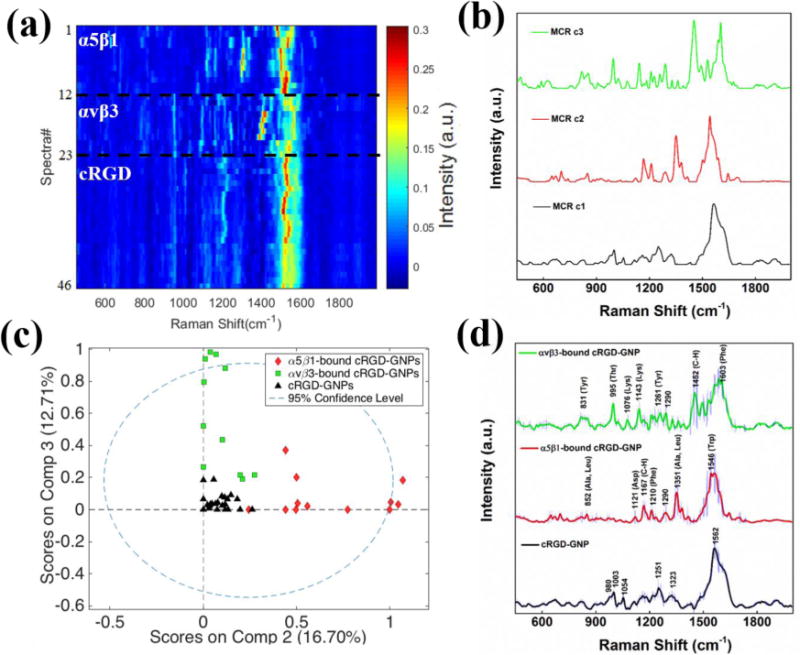
Figure 1.

(a) Heat map constructed with normalized SERS spectra of cRGD-GNPs (n=23), α5β1-bound cRGD-GNPs (n=12), and αvβ3-bound cRGD-GNPs (n=11). (b) Three pure components generated from SERS data by MCR analysis. (c) MCR scores of the SERS data on two major components (c2 and c3). (d) Average SERS spectra. Shaded area represents standard deviation of the spectra at each frequency.
